Huntsville: Fire Incidents, Utah (UT)
Where are fire incidents reported in Huntsville, UT
Something went wrong! Please refresh the page.
|
| |||||||||||||||||||||||||||||||||||||||||||||||||||||||||||||||||||||||||||||||||||||||||||||||||||||||||||||
2002 - 2018 National Fire Incident Reporting System (NFIRS) incidents
- Incident types reported to NFIRS in Huntsville, UT
- 46848.7%Rescue & EMS
- 18519.3%Fire
- 15916.5%Good Intent Call
- 747.7%Hazardous Condition
- 495.1%False Alarm
- 181.9%Service Call
- 40.4%Special Incident
- 30.3%Overpressure Rupture
- 10.1%Severe Weather
- Fire incident types reported to NFIRS in Huntsville, UT
- 11361.1%Outside Fires
- 3217.3%Structure Fires
- 2413.0%Other
- 168.6%Mobile Property/Vehicle Fires
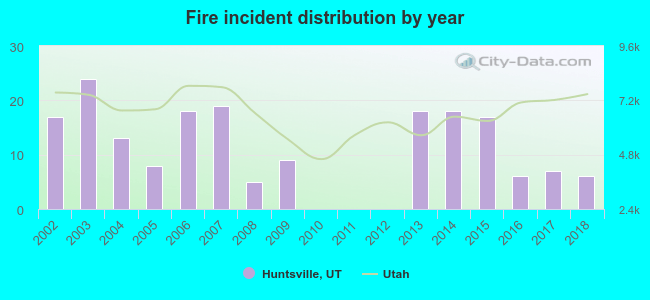 According to the data from the years 2002 - 2018 the average number of fires per year is 11. The highest number of reported fires - 24 took place in 2003, and the least - 0 in 2010. The data has a declining trend.
 23.2% incidents where reported in the morning and 76.8% in the evening. The most fires (17.8%) took place on Sunday, and the least (8.6%) on Wednesday.
 Based on the 185 fire incident reports from years 2002 - 2018 most fires (17.8%) took place during August, and the least (2.7%) in February.
 Out of all 961 cases reported during the years 2002 - 2018, the most belonged to the categories: Rescue & EMS (48.7%), Fire (19.3%), and Good Intent Call (16.5%).
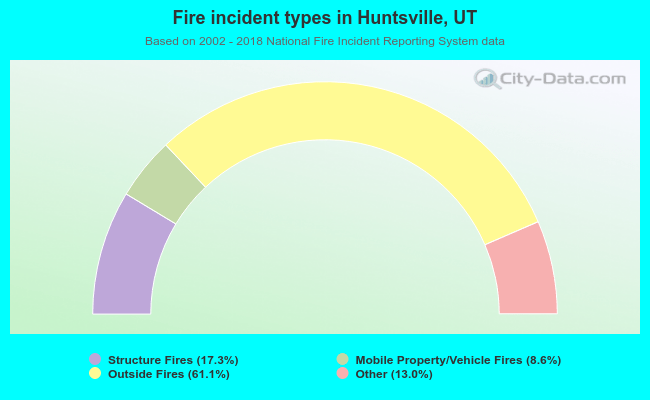 When looking into fire subcategories, the most reports belonged to: Outside Fires (61.1%), and Structure Fires (17.3%).