Hyattsville: Fire Incidents, Maryland (MD)
Where are fire incidents reported in Hyattsville, MD
Something went wrong! Please refresh the page.
|
| |||||||||||||||||||||||||||||||||||||||||||||||||||||||||||||||||||||||||||||||||||||||||||||||||||||||||||||
| Other | 65 | |||||||||||||||||||||||||||||||||||||||||||||||||||||||||||||||||||||||||||||||||||||||||||||||||||||||||||||
2005 - 2018 National Fire Incident Reporting System (NFIRS) incidents
- Incident types reported to NFIRS in Hyattsville, MD
- 18,60180.6%Rescue & EMS
- 1,2435.4%Good Intent Call
- 1,0304.5%False Alarm
- 8813.8%Hazardous Condition
- 8433.7%Fire
- 4261.8%Service Call
- 370.2%Special Incident
- Fire incident types reported to NFIRS in Hyattsville, MD
- 48056.9%Structure Fires
- 15618.5%Outside Fires
- 13315.8%Mobile Property/Vehicle Fires
- 748.8%Other
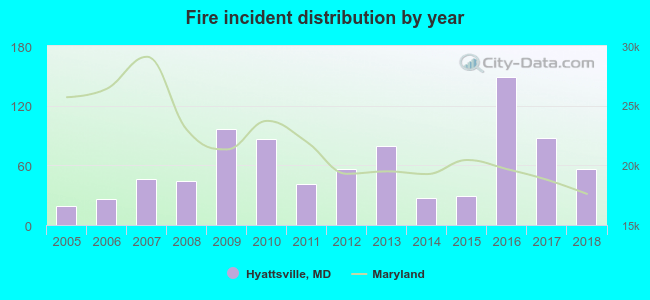 According to the data from the years 2005 - 2018 the average number of fires per year is 60. The highest number of fire incidents - 149 took place in 2016, and the least - 19 in 2005. The data has a growing trend.
The average number of yearly fire incidents per 10k residents in Hyattsville, MD compared to nearest cities:
(Note: Based on data for the last 3 years, including only cities with population 5,000 and above)
| Hyattsville: | 52.8 |
| Mount Rainier: | 8.9 |
| Bladensburg: | 3.5 |
| Adelphi: | 1.1 |
| College Park: | 2.5 |
| Takoma Park: | 14.0 |
| Landover: | 3.2 |
| Greenbelt: | 3.5 |
| Lanham: | 14.1 |
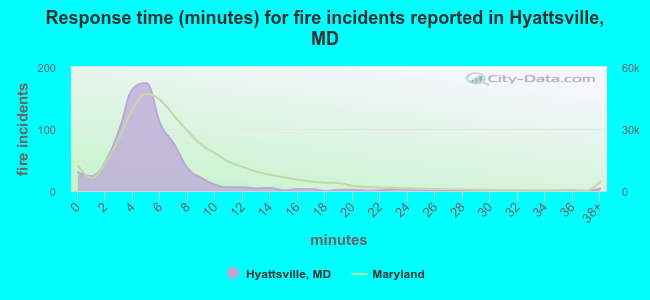 The median response time based on all reported fire incidents is 5 minutes. This is lower than the state median value.
The median response time in Hyattsville, MD compared to nearest cities:
(Note: Based on data for all years, including only cities with at least 500 fire incidents)
| Hyattsville: | 5 minutes |
| Bladensburg: | 5 minutes |
| Chillum: | 6 minutes |
| Takoma Park: | 5 minutes |
| Landover: | 5 minutes |
| Washington: | 4 minutes |
| Lanham: | 7 minutes |
| Silver Spring: | 5 minutes |
| Beltsville: | 6 minutes |
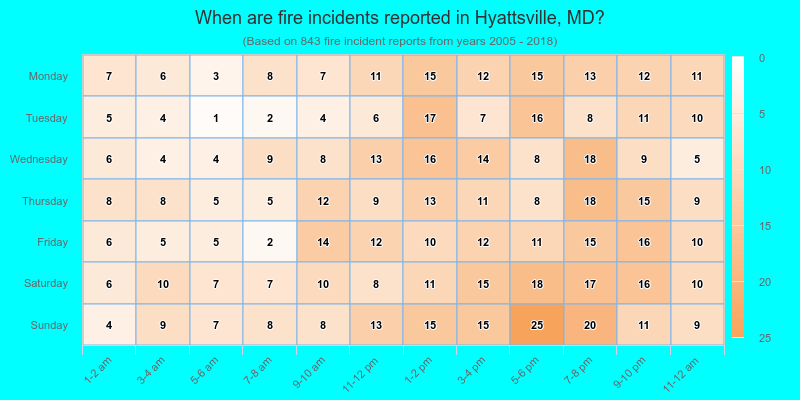
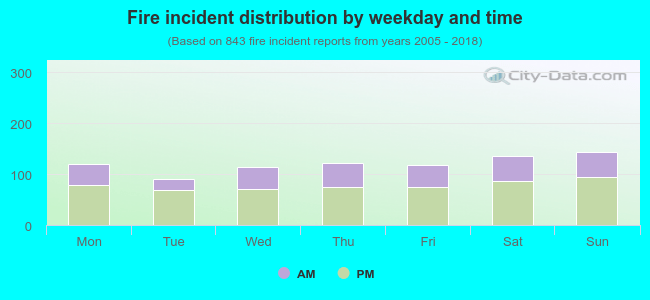 35.1% incidents where reported in the morning and 64.9% in the evening. The most fires (17.1%) took place on Sunday, and the least (10.8%) on Tuesday.
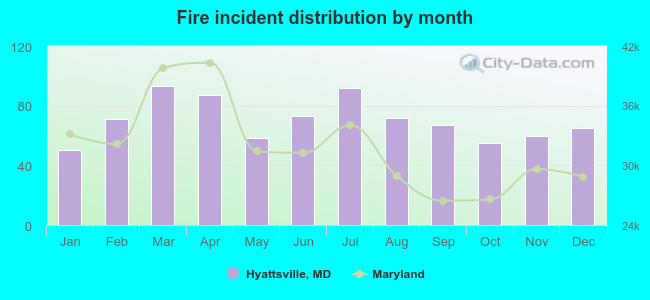 According to the 843 incident reports from years 2005 - 2018 most fires (11.0%) took place during March, and the least (5.9%) in January.
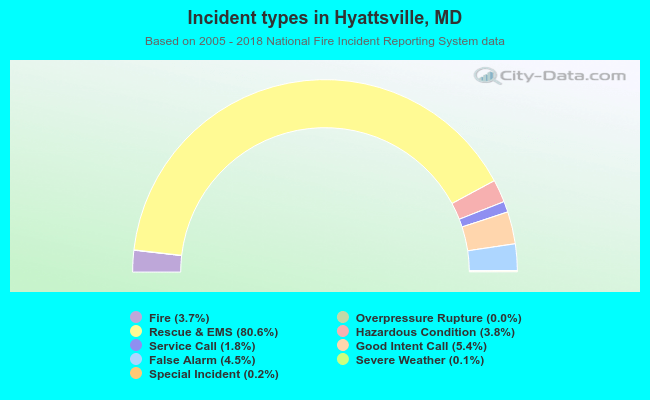 Out of all 23,087 cases reported during the years 2005 - 2018, the most belonged to the categories: Rescue & EMS (80.6%), Good Intent Call (5.4%), and False Alarm (4.5%).
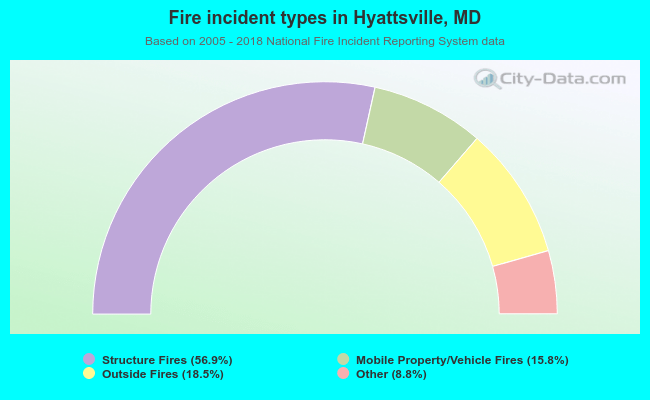 When looking into fire subcategories, the most incidents belonged to: Structure Fires (56.9%), and Outside Fires (18.5%).