Hymera: Fire Incidents, Indiana (IN)
Where are fire incidents reported in Hymera, IN
Something went wrong! Please refresh the page.
|
| |||||||||||||||||||||||||||||||||||||||||||||||||||||||||||||||||||||||||||||||||||||||||||||||||||||||||||||
2003 - 2017 National Fire Incident Reporting System (NFIRS) incidents
- Incident types reported to NFIRS in Hymera, IN
- 10549.3%Fire
- 7032.9%Rescue & EMS
- 2612.2%Hazardous Condition
- 62.8%Good Intent Call
- 31.4%Service Call
- 10.5%False Alarm
- 10.5%Severe Weather
- 10.5%Special Incident
- Fire incident types reported to NFIRS in Hymera, IN
- 5148.6%Outside Fires
- 4744.8%Structure Fires
- 76.7%Mobile Property/Vehicle Fires
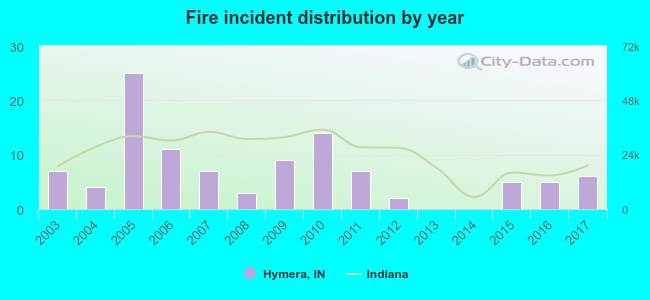 Based on the data from the years 2003 - 2017 the average number of fires per year is 7. The highest number of fire incidents - 25 took place in 2005, and the least - 0 in 2013. The data has a decreasing trend.
 27.6% incidents where reported in the morning and 72.4% in the evening. The most fires (21.9%) took place on Saturday, and the least (9.5%) on Wednesday.
 According to the 105 fires from years 2003 - 2017 most fires (14.3%) took place during August, and the least (1.0%) in January.
 Out of all 213 cases reported during the years 2003 - 2017, the most belonged to the categories: Fire (49.3%), Overpressure Rupture (32.9%), and Rescue & EMS (12.2%).
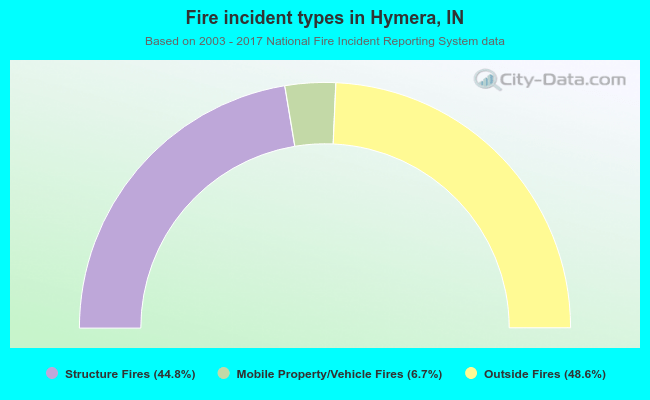 When looking into fire subcategories, the most reports belonged to: Outside Fires (48.6%), and Structure Fires (44.8%).