Independence: Fire Incidents, Kansas (KS)
Where are fire incidents reported in Independence, KS
Something went wrong! Please refresh the page.
| Fire incidents reported | |
|---|---|
| Sreet name | Count |
| MAIN | 162 |
| 10TH | 154 |
| PENNSYLVANIA AVE | 136 |
| LAUREL | 112 |
| MYRTLE | 78 |
| 8TH | 54 |
| SYCAMORE | 54 |
| 6TH | 52 |
| MAPLE | 52 |
| 12TH | 50 |
| RIVERSIDE PARK | 48 |
| 17TH | 46 |
| 9TH | 46 |
| COUNTY ROAD 3900 | 42 |
| 2ND | 40 |
| 5TH | 40 |
| COUNTY ROAD 3600 | 40 |
| PETER PAN RD | 40 |
| 11TH | 38 |
| COUNTY ROAD 4200 | 36 |
| 13TH | 34 |
| PINE | 34 |
| 19TH | 32 |
| COUNTY ROAD 4000 | 32 |
| 21ST | 30 |
| U.S. HIGHWAY 160 | 30 |
| 15TH | 28 |
| TAYLOR RD | 28 |
| 4TH | 26 |
| PETER PAN ROAD | 26 |
| Other | 197 |
2002 - 2018 National Fire Incident Reporting System (NFIRS) incidents
- Incident types reported to NFIRS in Independence, KS
- 6,70557.1%Rescue & EMS
- 2,13018.1%Hazardous Condition
- 1,81715.5%Fire
- 4323.7%False Alarm
- 3493.0%Good Intent Call
- 2822.4%Service Call
- 130.1%Severe Weather
- 130.1%Special Incident
- Fire incident types reported to NFIRS in Independence, KS
- 96252.9%Outside Fires
- 62034.1%Structure Fires
- 1799.9%Mobile Property/Vehicle Fires
- 563.1%Other
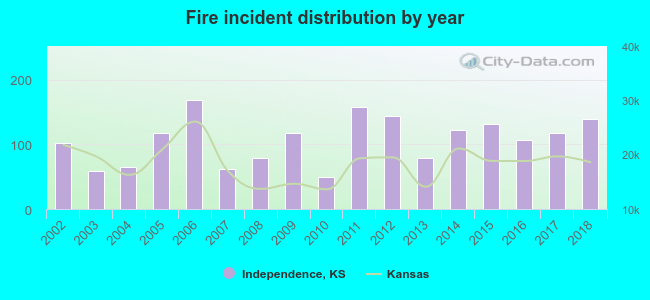 According to the data from the years 2002 - 2018 the average number of fire incidents per year is 107. The highest number of fires - 168 took place in 2006, and the least - 50 in 2010. The data has a rising trend.
The average number of yearly fire incidents per 10k residents in Independence, KS compared to nearest cities:
(Note: Based on data for the last 3 years, including only cities with population 5,000 and above)
| Independence: | 132.4 |
| Coffeyville: | 129.3 |
| Parsons: | 91.1 |
| Chanute: | 98.3 |
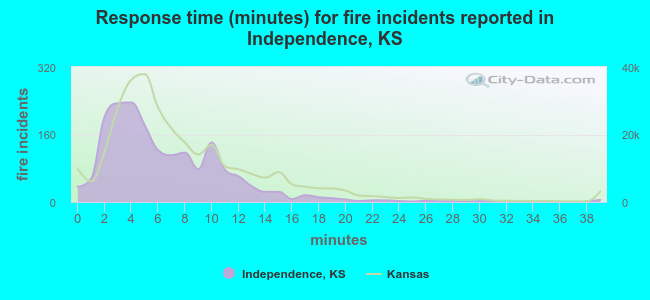 The median response time based on all reported fire incidents is 5 minutes. This is lower than the state median value.
The median response time in Independence, KS compared to nearest cities:
(Note: Based on data for all years, including only cities with at least 500 fire incidents)
| Independence: | 5 minutes |
| Cherryvale: | 7 minutes |
| Neodesha: | 5 minutes |
| Coffeyville: | 5 minutes |
| Parsons: | 6 minutes |
| Chanute: | 6 minutes |
| Chetopa: | 6 minutes |
| Yates Center: | 10 minutes |
| Columbus: | 10 minutes |
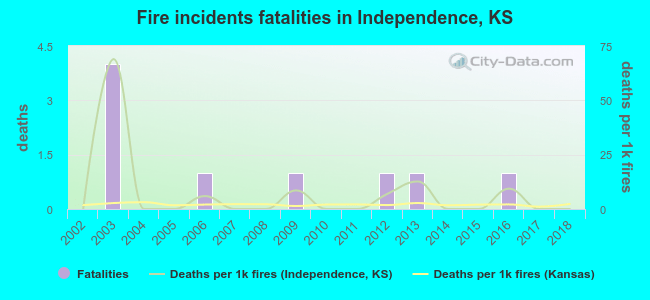 According to the data from the years 2002 - 2018 the average number of fire-related fatalities per year is 1. The highest number of reported deaths - 4 took place in 2003, and the lowest - 0 in 2002. The data has a constant trend.
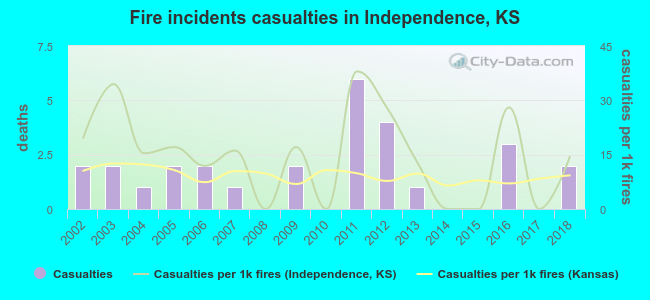 Based on the reports from the years 2002 - 2018 the average number of fire-related casualties per year is 2. The highest number of casualties - 6 took place in 2011, and the lowest - 0 in 2008. The data has a constant trend.
The average number of injuries per 1,000 fires is 15. This indicator was the highest - 38 in 2011, and the lowest 0 in 2008. The trend for injuries per 1,000 fire incidents is dropping. Compared to the Kansas value the number of injuries per 1,000 fire incidents is higher.
Based on the reports from the years 2002 - 2018 the average number of fire-related casualties per year is 2. The highest number of casualties - 6 took place in 2011, and the lowest - 0 in 2008. The data has a constant trend.
The average number of injuries per 1,000 fires is 15. This indicator was the highest - 38 in 2011, and the lowest 0 in 2008. The trend for injuries per 1,000 fire incidents is dropping. Compared to the Kansas value the number of injuries per 1,000 fire incidents is higher.Casualties per 1,000 incidents in Independence, KS compared to nearest cities:
(Note: Based on data for all years, including only cities with at least 500 fire incidents)
| Independence: | 15.4 |
| Cherryvale: | 3.5 |
| Neodesha: | 12.3 |
| Coffeyville: | 9.1 |
| Parsons: | 9.1 |
| Chanute: | 11.8 |
| Chetopa: | 0.0 |
| Yates Center: | 0.0 |
| Columbus: | 0.5 |
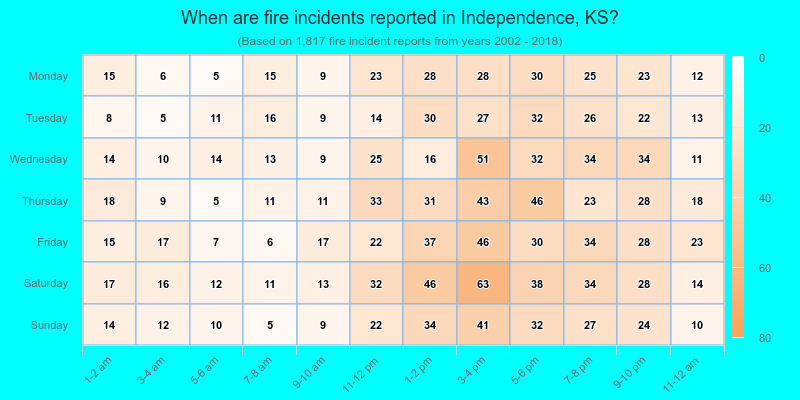
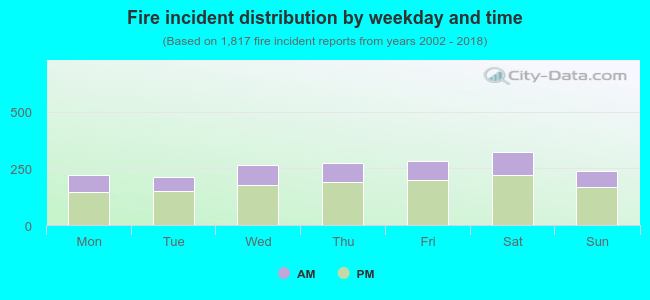 31.1% incidents where reported in the morning and 68.9% in the evening. The most fires (17.8%) took place on Saturday, and the least (11.7%) on Tuesday.
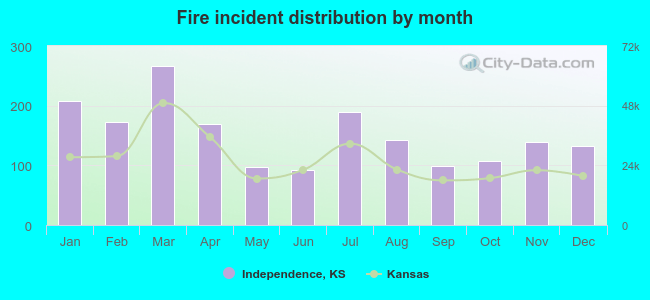 Based on the 1,817 incident reports from years 2002 - 2018 most fires (14.7%) took place during March, and the least (5.1%) in June.
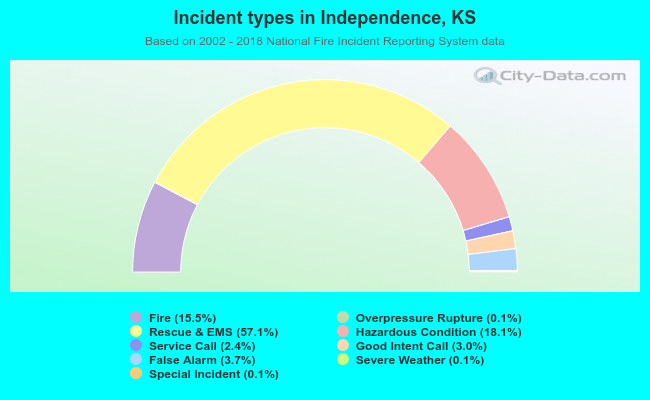 Out of all 11,747 cases reported during the years 2002 - 2018, the most belonged to the categories: Rescue & EMS (57.1%), Hazardous Condition (18.1%), and Fire (15.5%).
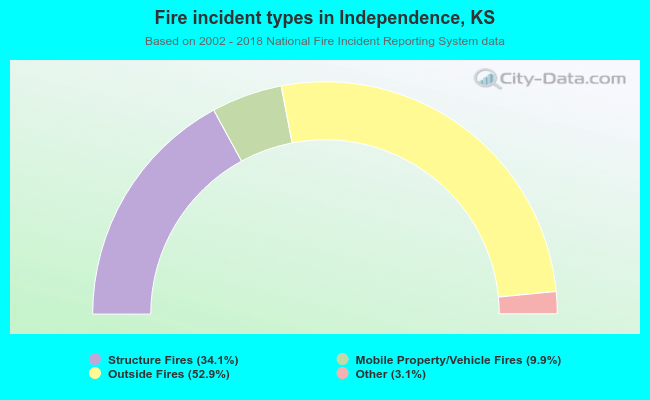 When looking into fire subcategories, the most incidents belonged to: Outside Fires (52.9%), and Structure Fires (34.1%).