| Fire incidents reported |
|---|
| Sreet name | Count |
|---|
| WILSON HWY | 20 | | BEAVER DAM RD | 16 | | MAIN ST | 14 | | FOX CREEK RD | 12 | | INDEPENDENCE AVE | 12 | | LUMBER LN | 12 | | RIVERSIDE DR | 12 | | GOLD HILL RD | 8 | | POWERHOUSE RD | 8 | | BEDWELL ST | 6 | | E MAIN STREET | 6 | | GRAYSON PKWY | 6 | | NICHOLS DR | 6 | | PEACH BOTTOM RD | 6 | | 58 | 4 | | BETHANY RD | 4 | | BIG RIDGE RD | 4 | | CARPENTER ST | 4 | | CORNERSTONE RD | 4 | | DIXIE RD | 4 | | ELLIOT PL | 4 | | FAMILY LANE | 4 | | FAMILY LN | 4 | | FLATRIDGE RD | 4 | | FOREST RIDGE RD | 4 |
| | | Fire incidents reported |
|---|
| Sreet name | Count |
|---|
| HINES BRANCH RD | 4 | | LOCUST ST | 4 | | ORCHID LN | 4 | | PENNY LN | 4 | | PINE MOUNTAIN ROAD ROAD | 4 | | POWER HOUSE RD | 4 | | S INDEPENDENCE AVE | 4 | | STONES CHAPPEL RD | 4 | | COUNTY LINE RD | 2 | | 1024 FOX CREEK RD | 2 | | 1146 HARDIN ROAD | 2 | | 115 ANDERSON ST. | 2 | | 170 CLOVER LANE | 2 | | 1908 COURTHOUSE | 2 | | 198 HARDIN RD RD | 2 | | 21 LGTS | 2 | | 280 GRASSY KNOB RD | 2 | | 4018 FOX CREEK RD | 2 | | 407 LUMBER LN | 2 | | 5241 WILSON HWY | 2 | | 97 HORSE FORD LANE | 2 | | AUSTIN ST | 2 | | BATTLEFIELD DR | 2 | | BEAVER DAM | 2 | | BEAVER STONE LN | 2 |
|
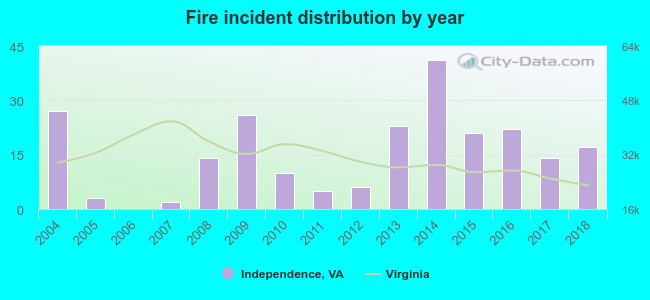 According to the data from the years 2004 - 2018 the average number of fire incidents per year is 15. The highest number of fires - 41 took place in 2014, and the least - 0 in 2006. The data has a dropping trend.
 24.2% incidents where reported in the morning and 75.8% in the evening. The most fires (19.0%) took place on Saturday, and the least (9.1%) on Sunday.
 Based on the 231 fires from years 2004 - 2018 most fires (16.0%) took place during April, and the least (2.2%) in August.
 Out of all 677 cases reported during the years 2004 - 2018, the most belonged to the categories: Fire (34.1%), Overpressure Rupture (30.1%), and Service Call (19.1%).
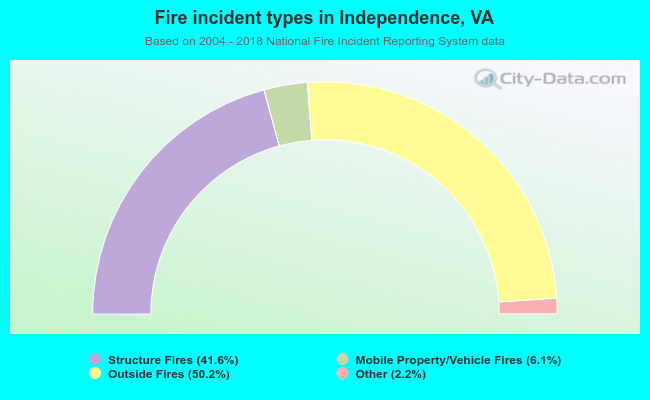 When looking into fire subcategories, the most reports belonged to: Outside Fires (50.2%), and Structure Fires (41.6%).