| Fire incidents reported |
|---|
| Sreet name | Count |
|---|
| STRAITS HWY | 110 | | I-75 HWY | 28 | | M68 HWY | 28 | | I75 HWY | 26 | | M-68 HWY | 24 | | PARKE RD | 24 | | MULLETT LAKE RD | 20 | | WHITE RD | 18 | | BRUDY RD | 16 | | CHIPPEWA BEACH RD | 14 | | CLUB RD | 12 | | SOUTH STRAITS HWY | 12 | | DEVEREAUX LAKE RD | 10 | | REAMS RD | 10 | | RESORT RD | 10 | | STRAITS HWY HWY | 10 | | WILDWOOD RD | 10 | | WILSON RD | 10 | | AFTON RD | 8 | | EAST MULLETT LAKE RD | 8 | | INDIAN WOODS TRL | 8 | | LANAI DR | 8 | | QUAIL TRL | 8 | | RAINBOWS END TRL | 8 | | FOREST TRL | 6 |
| | | Fire incidents reported |
|---|
| Sreet name | Count |
|---|
| HACKLEBURG RD | 6 | | HAROLD B ST | 6 | | MILLER RD | 6 | | ONAWAY RD | 6 | | PAULA DR | 6 | | PLYMOUTH BEACH DR | 6 | | PLYMOUTH BEACH RD | 6 | | STURGEON VALLEY DR | 6 | | TEMPLE RD | 6 | | ALOHA DR | 4 | | ARLENE AVE | 4 | | ARTHUR HILLS RD | 4 | | BANWELL RD | 4 | | BARBARA AVE | 4 | | BERRY CREEK RD | 4 | | BIG SKY TRL | 4 | | BROWN RD | 4 | | CARTER RD | 4 | | FISHER WOODS RD | 4 | | GRANDVIEW BEACH RD | 4 | | GRATIOT ST | 4 | | I-75 EXP | 4 | | IVERSON TRL | 4 | | JACIUK RD | 4 | | JACKSON DR | 4 |
|
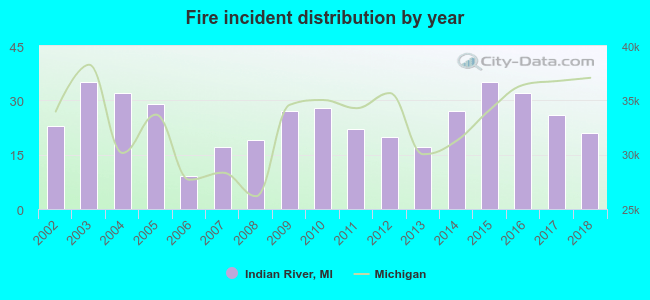 Based on the data from the years 2002 - 2018 the average number of fires per year is 25. The highest number of fires - 35 took place in 2003, and the least - 9 in 2006. The data has a declining trend.
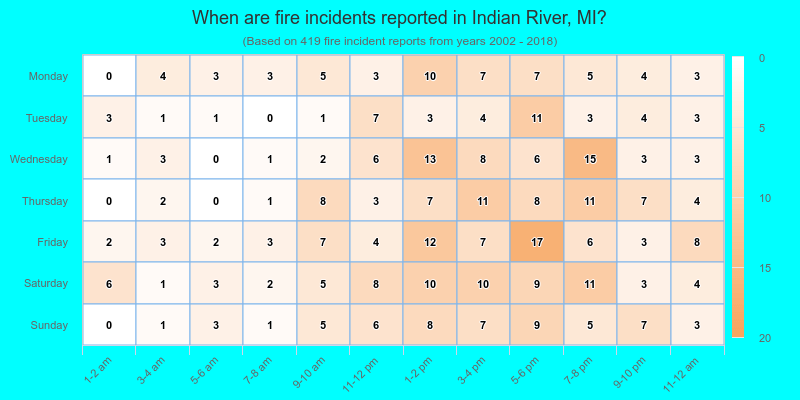
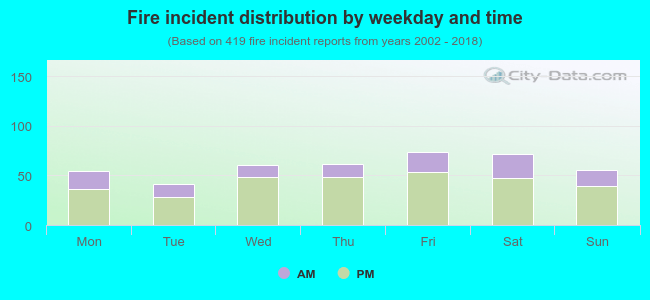 28.6% incidents where reported in the morning and 71.4% in the evening. The most fires (17.7%) took place on Friday, and the least (9.8%) on Tuesday.
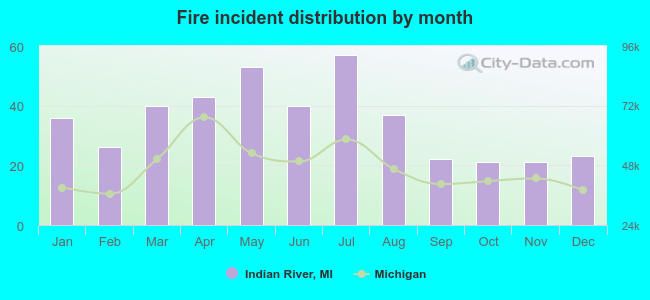 According to the 419 fire incident reports from years 2002 - 2018 most fires (13.6%) took place during July, and the least (5.0%) in October.
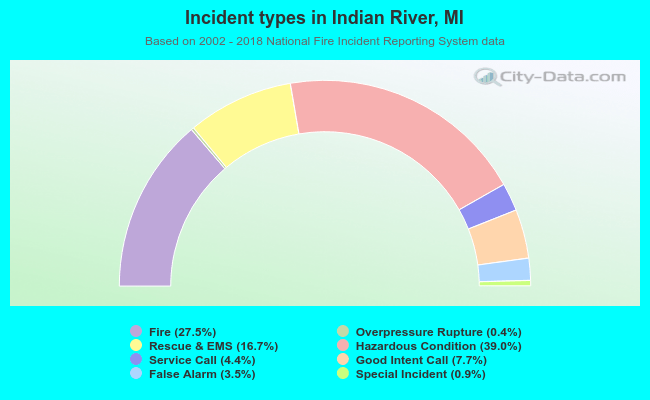 Out of all 1,522 cases reported during the years 2002 - 2018, the most belonged to the categories: Hazardous Condition (39.0%), Fire (27.5%), and Rescue & EMS (16.7%).
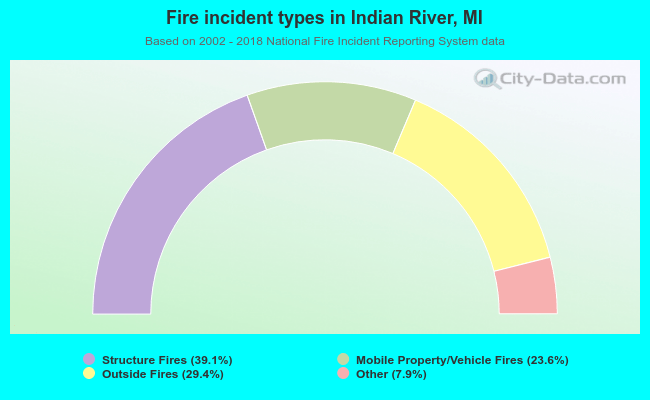 When looking into fire subcategories, the most reports belonged to: Structure Fires (39.1%), and Outside Fires (29.4%).