Inwood: Fire Incidents, New York (NY)
Where are fire incidents reported in Inwood, NY
Something went wrong! Please refresh the page.
|
| |||||||||||||||||||||||||||||||||||||||||||||||||||||||||||||||||||||||||||||||||||||||||||||||||||||||||||||
2004 - 2018 National Fire Incident Reporting System (NFIRS) incidents
- Incident types reported to NFIRS in Inwood, NY
- 1,75752.8%Rescue & EMS
- 41412.4%Hazardous Condition
- 40112.0%False Alarm
- 36110.8%Fire
- 2397.2%Good Intent Call
- 1544.6%Service Call
- Fire incident types reported to NFIRS in Inwood, NY
- 23164.0%Structure Fires
- 5314.7%Outside Fires
- 4311.9%Mobile Property/Vehicle Fires
- 349.4%Other
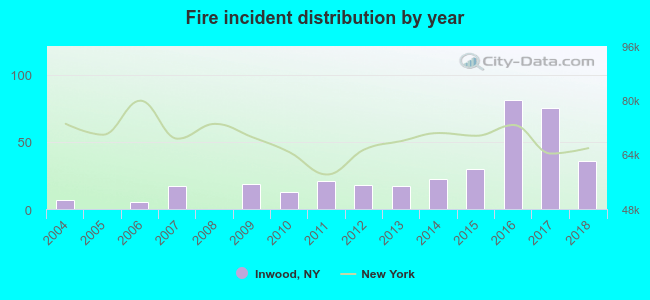 According to the data from the years 2004 - 2018 the average number of fire incidents per year is 24. The highest number of fires - 81 took place in 2016, and the least - 0 in 2005. The data has a rising trend.
The average number of yearly fire incidents per 10k residents in Inwood, NY compared to nearest cities:
(Note: Based on data for the last 3 years, including only cities with population 5,000 and above)
| Inwood: | 65.4 |
| Cedarhurst: | 28.5 |
| Lawrence: | 38.2 |
| Woodmere: | 17.7 |
| Hewlett: | 12.7 |
| Valley Stream: | 12.8 |
| East Rockaway: | 1.5 |
| Long Beach: | 14.9 |
| Lynbrook: | 6.6 |
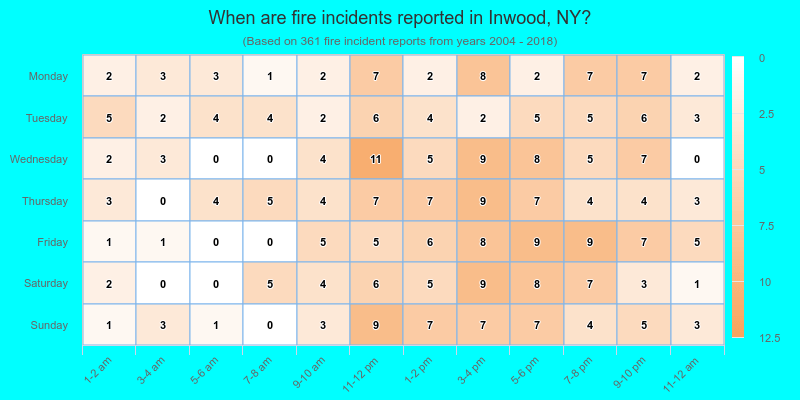
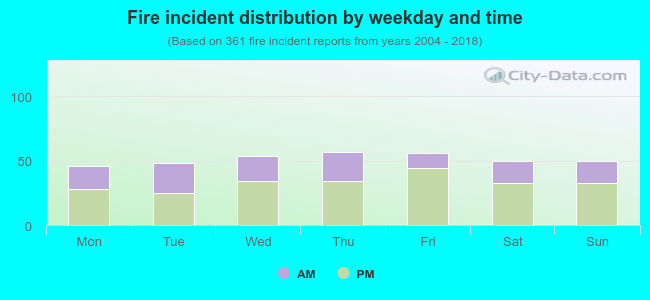 36.0% incidents where reported in the morning and 64.0% in the evening. The most fires (15.8%) took place on Thursday, and the least (12.7%) on Monday.
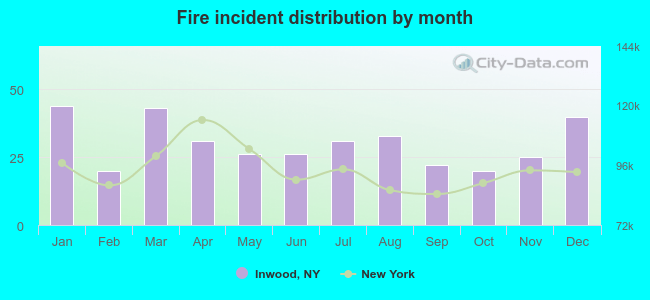 Based on the 361 fire incidents from years 2004 - 2018 most fires (12.2%) took place during January, and the least (5.5%) in February.
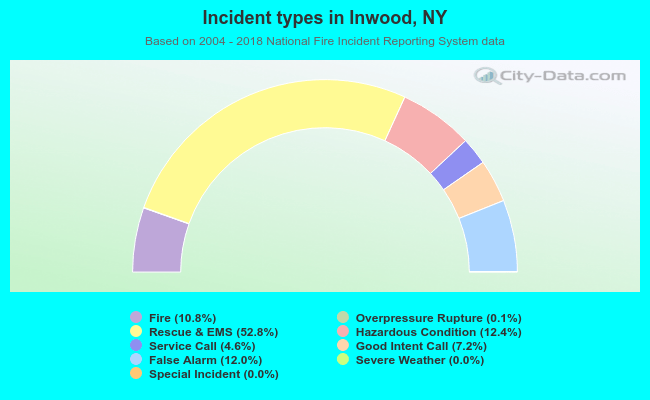 Out of all 3,330 cases reported during the years 2004 - 2018, the most belonged to the categories: Rescue & EMS (52.8%), Hazardous Condition (12.4%), and False Alarm (12.0%).
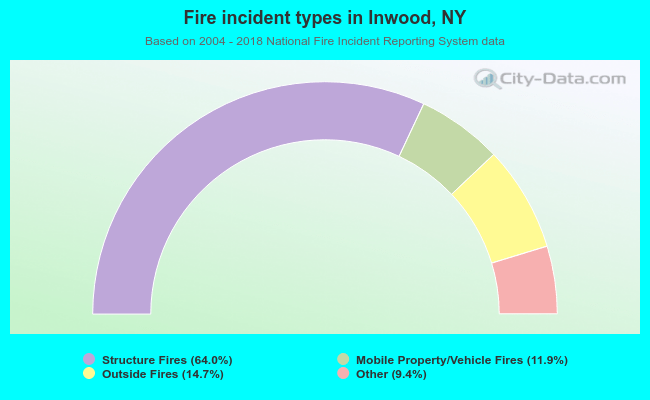 When looking into fire subcategories, the most reports belonged to: Structure Fires (64.0%), and Outside Fires (14.7%).