Ironton: Fire Incidents, Ohio (OH)
Where are fire incidents reported in Ironton, OH
Something went wrong! Please refresh the page.
| Fire incidents reported | |
|---|---|
| Sreet name | Count |
| 3RD ST | 204 |
| 5TH ST | 162 |
| 4TH ST | 138 |
| 2ND ST | 124 |
| 6TH ST | 116 |
| 9TH ST | 90 |
| 7TH ST | 80 |
| 8TH ST | 78 |
| 10TH ST | 54 |
| CO RD 181 RD | 52 |
| LAWRENCE ST | 50 |
| CO RD 22 RD | 40 |
| STATE ROUTE 141 SR | 40 |
| 1ST ST | 38 |
| CO RD 21 RD | 38 |
| 4TH | 34 |
| COUNTY RD 52 HWY | 34 |
| COUNTY ROAD 181 CR | 34 |
| STATE RT 243 HWY | 34 |
| 3RD | 30 |
| CO RD 7 RD | 30 |
| PARK AVE | 30 |
| TWP 268 RD | 30 |
| STATE ROUTE 243 | 28 |
| HAVERHILL OHIO FURNACE RO | 26 |
| BUCKHORN ST | 24 |
| COAL BANK HOLLOW | 24 |
| DISTERDICK LANE | 24 |
| MASTIN AVE | 24 |
| IRONTON HILLS DR | 22 |
| Other | 609 |
2002 - 2018 National Fire Incident Reporting System (NFIRS) incidents
- Incident types reported to NFIRS in Ironton, OH
- 3,05133.2%Hazardous Condition
- 2,34125.5%Fire
- 1,39815.2%Rescue & EMS
- 1,35914.8%Service Call
- 6086.6%Good Intent Call
- 3263.5%False Alarm
- 530.6%Severe Weather
- 460.5%Special Incident
- 100.1%Overpressure Rupture
- Fire incident types reported to NFIRS in Ironton, OH
- 1,00643.0%Structure Fires
- 94240.2%Outside Fires
- 38616.5%Mobile Property/Vehicle Fires
- 70.3%Other
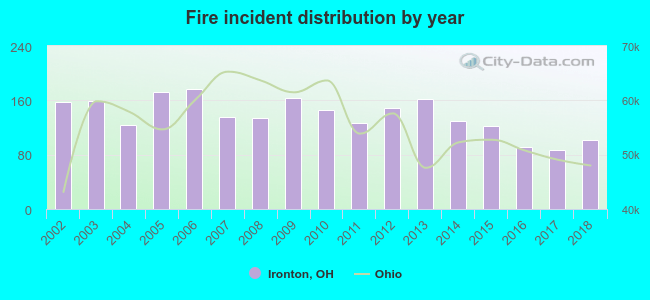 Based on the data from the years 2002 - 2018 the average number of fires per year is 138. The highest number of fire incidents - 177 took place in 2006, and the least - 87 in 2017. The data has a declining trend.
The average number of yearly fire incidents per 10k residents in Ironton, OH compared to nearest cities:
(Note: Based on data for the last 3 years, including only cities with population 5,000 and above)
| Ironton: | 85.2 |
| Wheelersburg: | 76.1 |
| Portsmouth: | 82.0 |
| Jackson: | 157.0 |
 The median response time based on all reported fire incidents is 5 minutes. This is lower than the state median value.
The median response time in Ironton, OH compared to nearest cities:
(Note: Based on data for all years, including only cities with at least 500 fire incidents)
| Ironton: | 5 minutes |
| Ashland: | 4 minutes |
| Greenup: | 8 minutes |
| Catlettsburg: | 7 minutes |
| South Point: | 11 minutes |
| Chesapeake: | 12 minutes |
| Wheelersburg: | 8 minutes |
| Proctorville: | 12 minutes |
| Grayson: | 12 minutes |
 According to the data from the years 2002 - 2018 the average number of fire-related yearly deaths is 0. The highest number of reported deaths - 4 took place in 2004, and the lowest - 0 in 2002. The data has a constant trend.
 Based on the reports from the years 2002 - 2018 the average number of fire-related yearly casualties is 2. The highest number of injuries - 6 took place in 2011, and the lowest - 0 in 2002. The data has a constant trend.
The average number of injuries per 1,000 fires is 15. This indicator was the highest - 47 in 2011, and the lowest 0 in 2002. The trend for injuries per 1,000 fire incidents is constant. Compared to the state value the number of casualties per 1,000 fires is about the same.
Based on the reports from the years 2002 - 2018 the average number of fire-related yearly casualties is 2. The highest number of injuries - 6 took place in 2011, and the lowest - 0 in 2002. The data has a constant trend.
The average number of injuries per 1,000 fires is 15. This indicator was the highest - 47 in 2011, and the lowest 0 in 2002. The trend for injuries per 1,000 fire incidents is constant. Compared to the state value the number of casualties per 1,000 fires is about the same.Casualties per 1,000 incidents in Ironton, OH compared to nearest cities:
(Note: Based on data for all years, including only cities with at least 500 fire incidents)
| Ironton: | 14.5 |
| Ashland: | 3.6 |
| Greenup: | 1.7 |
| Catlettsburg: | 9.4 |
| South Point: | 0.8 |
| Chesapeake: | 2.9 |
| Wheelersburg: | 21.6 |
| Proctorville: | 2.7 |
| Grayson: | 0.0 |
 30.3% incidents where reported in the morning and 69.7% in the evening. The most fires (15.5%) took place on Friday, and the least (12.7%) on Thursday.
 According to the 2,341 fire incidents from years 2002 - 2018 most fires (12.0%) took place during April, and the least (6.0%) in December.
 Out of all 9,192 cases reported during the years 2002 - 2018, the most belonged to the categories: Hazardous Condition (33.2%), Fire (25.5%), and Rescue & EMS (15.2%).
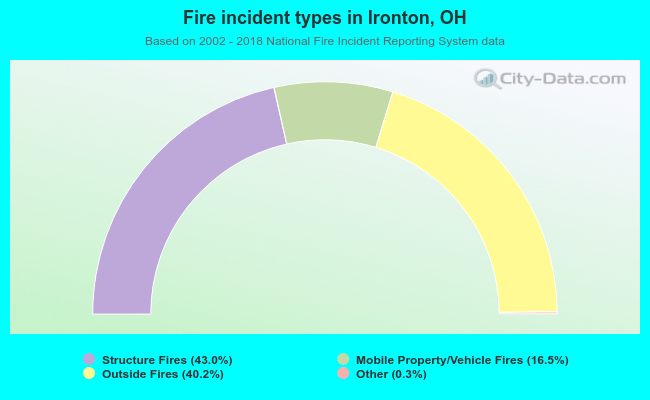 When looking into fire subcategories, the most incidents belonged to: Structure Fires (43.0%), and Outside Fires (40.2%).