Irvington: Fire Incidents, New Jersey (NJ)
Where are fire incidents reported in Irvington, NJ
Something went wrong! Please refresh the page.
| Fire incidents reported | |
|---|---|
| Sreet name | Count |
| MARSHALL ST | 350 |
| UNION AV | 308 |
| GROVE ST | 226 |
| STUYVESANT AV | 218 |
| NYE AV | 164 |
| SPRINGFIELD AV | 144 |
| CLINTON AV | 138 |
| CHANCELLOR AV | 128 |
| 21ST ST | 104 |
| GROVE ST | 104 |
| MYRTLE AV | 100 |
| LYONS AV | 92 |
| MARSHALL ST | 72 |
| SPRINGFIELD AVE | 64 |
| UNION AVE | 58 |
| 40TH ST | 56 |
| 22ND ST | 54 |
| ELLIS AVE | 54 |
| STUYVESANT AVE | 52 |
| ELLIS AV | 50 |
| LINDEN AV | 50 |
| MAPLE AV | 50 |
| ORANGE AV | 44 |
| PARK PL | 42 |
| 21ST ST | 40 |
| PAINE AV | 40 |
| CIVIC SQ | 38 |
| CLINTON AVE | 36 |
| EASTERN PY | 34 |
| GRACE ST | 34 |
| Other | 201 |
2004 - 2018 National Fire Incident Reporting System (NFIRS) incidents
- Incident types reported to NFIRS in Irvington, NJ
- 3,38229.4%Hazardous Condition
- 3,14527.4%Fire
- 2,50621.8%Service Call
- 1,46312.7%False Alarm
- 5895.1%Good Intent Call
- 2882.5%Rescue & EMS
- 810.7%Overpressure Rupture
- 300.3%Special Incident
- Fire incident types reported to NFIRS in Irvington, NJ
- 2,36575.2%Structure Fires
- 44414.1%Outside Fires
- 32010.2%Mobile Property/Vehicle Fires
- 160.5%Other
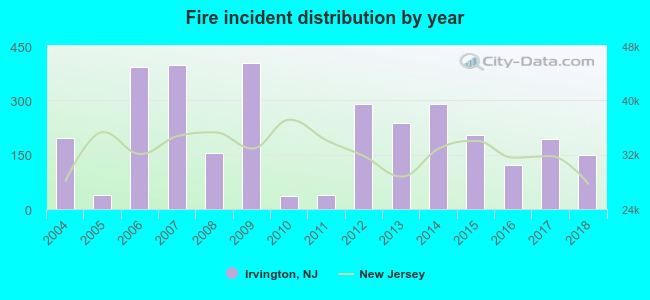 According to the data from the years 2004 - 2018 the average number of fire incidents per year is 209. The highest number of reported fires - 404 took place in 2009, and the least - 35 in 2010. The data has a dropping trend.
The average number of yearly fire incidents per 10k residents in Irvington, NJ compared to nearest cities:
(Note: Based on data for the last 3 years, including only cities with population 5,000 and above)
| Irvington: | 26.2 |
| Maplewood: | 42.0 |
| South Orange: | 24.3 |
| Hillside: | 34.1 |
| Newark: | 41.2 |
| Union: | 27.8 |
| Orange: | 24.7 |
| East Orange: | 48.4 |
| Harrison: | 30.8 |
 The median response time based on all reported fire incidents is 3 minutes. This is lower compared to the state median value.
The median response time in Irvington, NJ compared to nearest cities:
(Note: Based on data for all years, including only cities with at least 500 fire incidents)
| Irvington: | 3 minutes |
| Maplewood: | 3 minutes |
| South Orange: | 3 minutes |
| Hillside: | 3 minutes |
| Newark: | 3 minutes |
| Union: | 5 minutes |
| Orange: | 3 minutes |
| East Orange: | 4 minutes |
| Harrison: | 2 minutes |
 According to the data from the years 2004 - 2018 the average number of fire-related yearly deaths is 1. The highest number of deaths - 2 took place in 2006, and the lowest - 0 in 2004. The data has a constant trend.
The average number of deaths per 1,000 fire incidents is 2. This indicator was the highest - 10 in 2015, and the lowest 0 in 2004. The trend for fatalities per 1,000 incidents is constant. Compared to the state value the number of deaths per 1,000 fire incidents is much higher.
According to the data from the years 2004 - 2018 the average number of fire-related yearly deaths is 1. The highest number of deaths - 2 took place in 2006, and the lowest - 0 in 2004. The data has a constant trend.
The average number of deaths per 1,000 fire incidents is 2. This indicator was the highest - 10 in 2015, and the lowest 0 in 2004. The trend for fatalities per 1,000 incidents is constant. Compared to the state value the number of deaths per 1,000 fire incidents is much higher.Deaths per 1,000 incidents in Irvington, NJ compared to nearest cities:
(Note: Based on data for all years, including only cities with at least 2,500 fire incidents)
| Irvington: | 2.9 |
| Newark: | 1.3 |
| Union: | 2.7 |
| East Orange: | 3.9 |
| Elizabeth: | 1.3 |
| Jersey City: | 0.9 |
| Hoboken: | 0.7 |
| Passaic: | 0.3 |
| Union City: | 2.6 |
 Based on the data from the years 2004 - 2018 the average number of fire-related casualties per year is 3. The highest number of casualties - 13 took place in 2007, and the lowest - 0 in 2005. The data has a constant trend.
The average number of casualties per 1,000 fire incidents is 12. This indicator was the highest - 33 in 2007, and the lowest 0 in 2005. The trend for injuries per 1,000 fires is increasing. Compared to the New Jersey value the number of injuries per 1,000 fire incidents is higher.
Based on the data from the years 2004 - 2018 the average number of fire-related casualties per year is 3. The highest number of casualties - 13 took place in 2007, and the lowest - 0 in 2005. The data has a constant trend.
The average number of casualties per 1,000 fire incidents is 12. This indicator was the highest - 33 in 2007, and the lowest 0 in 2005. The trend for injuries per 1,000 fires is increasing. Compared to the New Jersey value the number of injuries per 1,000 fire incidents is higher.Casualties per 1,000 incidents in Irvington, NJ compared to nearest cities:
(Note: Based on data for all years, including only cities with at least 500 fire incidents)
| Irvington: | 15.3 |
| Maplewood: | 18.6 |
| South Orange: | 8.9 |
| Hillside: | 3.4 |
| Newark: | 5.7 |
| Union: | 26.2 |
| Orange: | 6.0 |
| East Orange: | 10.9 |
| Harrison: | 8.3 |
 38.1% incidents where reported in the morning and 61.9% in the evening. The most fires (16.6%) took place on Sunday, and the least (12.9%) on Tuesday.
 According to the 3,145 fire incident reports from years 2004 - 2018 most fires (9.6%) took place during March, and the least (6.6%) in December.
 Out of all 11,491 cases reported during the years 2004 - 2018, the most belonged to the categories: Hazardous Condition (29.4%), Fire (27.4%), and Service Call (21.8%).
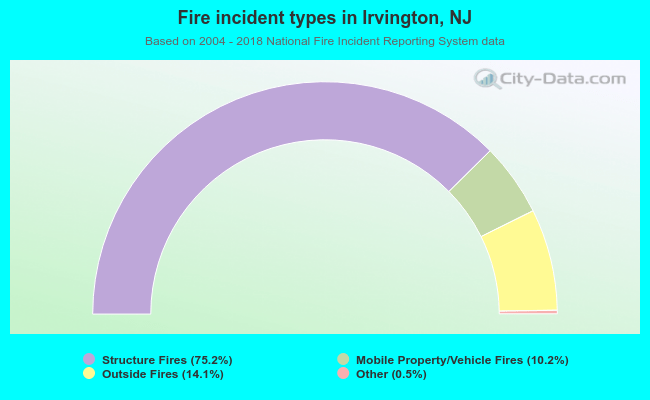 When looking into fire subcategories, the most reports belonged to: Structure Fires (75.2%), and Outside Fires (14.1%).