| Fire incidents reported |
|---|
| Sreet name | Count |
|---|
| VETERANS HIGHWAY | 60 | | MOTOR PARKWAY | 42 | | BLYDENBURGH ROAD | 28 | | EXPRESSWAY DRIVE NORTH | 28 | | SILVERLEAF LN | 22 | | HOFFMAN LANE | 20 | | VETERANS MEMORIAL HWY | 18 | | OLD NICHOLS ROAD | 16 | | EXPRESS DRIVE NORTH | 10 | | SNOWBERRY LN | 10 | | BRIDGE ROAD | 8 | | ENTER LANE | 8 | | EXPRESS DRIVE SOUTH | 8 | | LIE EXIT 57 WESTBOUND | 8 | | SCOTCH PINE DR | 8 | | SUFFOLK AVE | 8 | | EXPRESSWAY DRIVE SOUTH | 6 | | LIE EXIT 57 EASTBOUND | 6 | | OAKFOREST DR | 6 | | SAMPSON AVE | 6 | | BEDFORD DR | 4 | | GIBBS ROAD | 4 | | LIE EXIT 5756 WESTBOUND | 4 | | LIE EXIT 58 EASTBOUND | 4 | | LONG ISLAND EXPRESSWAY | 4 |
| | | Fire incidents reported |
|---|
| Sreet name | Count |
|---|
| OLD NICHOLS ROAD (PKG LOT) | 4 | | SAGEBRUSH LN | 4 | | SERPENTINE LN | 4 | | TOWNHOUSE VILLAGE RD | 4 | | BRANDON CREST COURT | 2 | | CORPORATE PLAZA RD | 2 | | DEAN ST | 2 | | DEAN STREET | 2 | | DEWEY STREET | 2 | | ENTER LANE & BRIDGE ROAD | 2 | | EXPRESS DR S & MOTOR PKWY @ 57 | 2 | | EXPRESS DRIVE N & BLYDENBURGH | 2 | | EXPRESSWAY DRIVE | 2 | | HOFFMAN LANE (I/F/O) | 2 | | HOFFMAN LANE (VICINITY OF) | 2 | | LIE EXIT 57 | 2 | | LIE EXIT 57 EASTBOUND | 2 | | LIE EXIT 57-56 WESTBOUND | 2 | | LIE EXIT58 57 WESTBOUND | 2 | | MOTOR PARKWAY & VETERANS HWY | 2 | | MOTOR PARKWAY (PKG LOT) | 2 | | NICHOLS RD | 2 | | PINE CONE LANE | 2 | | PINE CONE LN | 2 | | PINE CT | 2 |
|
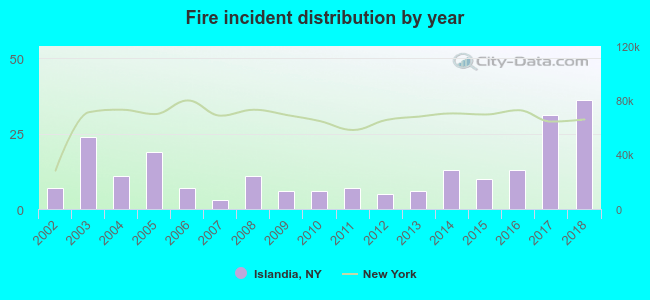 Based on the data from the years 2002 - 2018 the average number of fire incidents per year is 13. The highest number of fires - 36 took place in 2018, and the least - 3 in 2007. The data has a rising trend.
 36.3% incidents where reported in the morning and 63.7% in the evening. The most fires (17.2%) took place on Friday, and the least (10.7%) on Thursday.
 Based on the 215 fire incident reports from years 2002 - 2018 most fires (11.6%) took place during March, and the least (5.1%) in February.
 Out of all 1,743 cases reported during the years 2002 - 2018, the most belonged to the categories: False Alarm (25.5%), Hazardous Condition (24.6%), and Rescue & EMS (20.7%).
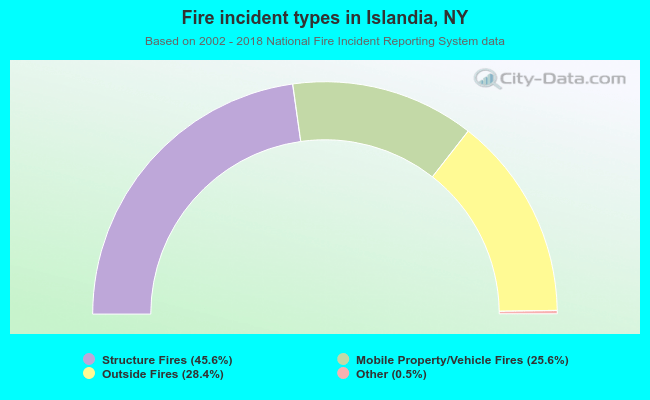 When looking into fire subcategories, the most incidents belonged to: Structure Fires (45.6%), and Outside Fires (28.4%).