Iuka: Fire Incidents, Mississippi (MS)
Where are fire incidents reported in Iuka, MS
Something went wrong! Please refresh the page.
|
| |||||||||||||||||||||||||||||||||||||||||||||||||||||||||||||||||||||||||||||||||||||||||||||||||||||||||||||
| Other | 766 | |||||||||||||||||||||||||||||||||||||||||||||||||||||||||||||||||||||||||||||||||||||||||||||||||||||||||||||
2003 - 2018 National Fire Incident Reporting System (NFIRS) incidents
- Incident types reported to NFIRS in Iuka, MS
- 2,27847.5%Fire
- 1,96741.0%Rescue & EMS
- 1483.1%Service Call
- 1292.7%Hazardous Condition
- 1282.7%Good Intent Call
- 1162.4%False Alarm
- 200.4%Severe Weather
- 50.1%Overpressure Rupture
- Fire incident types reported to NFIRS in Iuka, MS
- 1,18752.1%Outside Fires
- 79434.9%Structure Fires
- 22710.0%Mobile Property/Vehicle Fires
- 703.1%Other
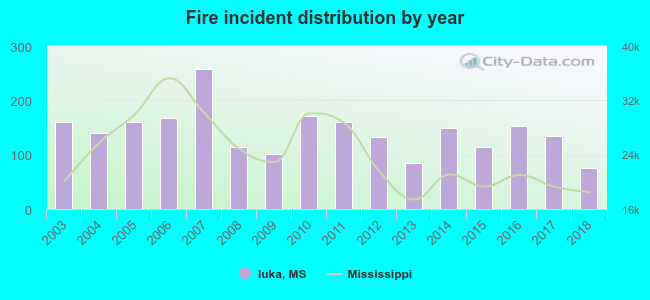 According to the data from the years 2003 - 2018 the average number of fire incidents per year is 142. The highest number of reported fire incidents - 258 took place in 2007, and the least - 76 in 2018. The data has a dropping trend.
 The median response time based on all reported fire incidents is 8 minutes. This is similar to the Mississippi median value.
The median response time in Iuka, MS compared to nearest cities:
(Note: Based on data for all years, including only cities with at least 500 fire incidents)
| Iuka: | 8 minutes |
| Burnsville: | 6 minutes |
| Tishomingo: | 9 minutes |
| Glen: | 8 minutes |
| Rienzi: | 11 minutes |
| Corinth: | 6 minutes |
| Belmont: | 5 minutes |
| Golden: | 7 minutes |
| Booneville: | 10 minutes |
 According to the data from the years 2003 - 2018 the average number of fire-related yearly deaths is 1. The highest number of deaths - 2 took place in 2009, and the lowest - 0 in 2003. The data has a constant trend.
 28.1% incidents where reported in the morning and 71.9% in the evening. The most fires (17.9%) took place on Saturday, and the least (12.1%) on Wednesday.
 Based on the 2,278 fires from years 2003 - 2018 most fires (15.5%) took place during March, and the least (5.2%) in September.
 Out of all 4,795 cases reported during the years 2003 - 2018, the most belonged to the categories: Fire (47.5%), Rescue & EMS (41.0%), and Service Call (3.1%).
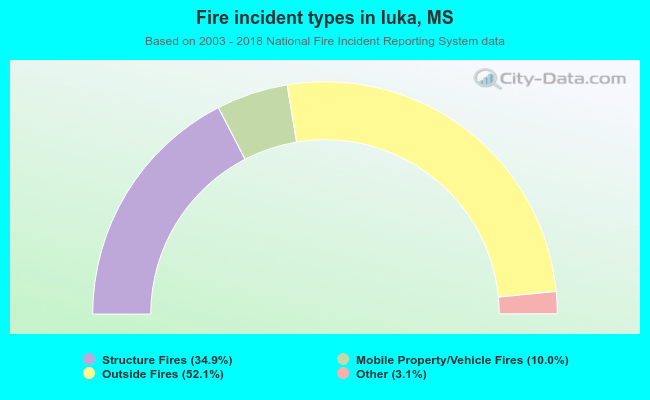 When looking into fire subcategories, the most incidents belonged to: Outside Fires (52.1%), and Structure Fires (34.9%).