Jacinto City: Fire Incidents, Texas (TX)
Where are fire incidents reported in Jacinto City, TX
Something went wrong! Please refresh the page.
|
| |||||||||||||||||||||||||||||||||||||||||||||||||||||||||||||||||||||||||||||||||||||||||||||||||||||||||||||
2003 - 2018 National Fire Incident Reporting System (NFIRS) incidents
- Incident types reported to NFIRS in Jacinto City, TX
- 1,60569.6%Rescue & EMS
- 29312.7%Fire
- 27912.1%Hazardous Condition
- 492.1%Good Intent Call
- 472.0%False Alarm
- 271.2%Service Call
- 30.1%Overpressure Rupture
- Fire incident types reported to NFIRS in Jacinto City, TX
- 14850.5%Structure Fires
- 8629.4%Outside Fires
- 5117.4%Mobile Property/Vehicle Fires
- 82.7%Other
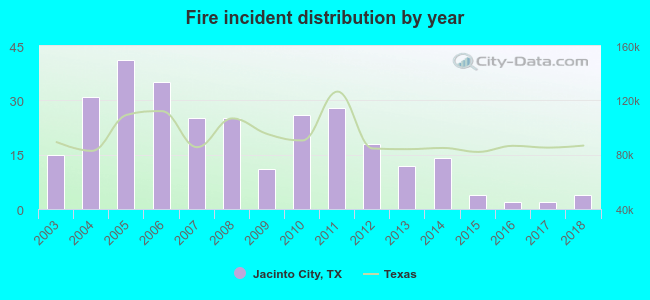 Based on the data from the years 2003 - 2018 the average number of fires per year is 18. The highest number of fires - 41 took place in 2005, and the least - 2 in 2016. The data has a decreasing trend.
The average number of yearly fire incidents per 10k residents in Jacinto City, TX compared to nearest cities:
(Note: Based on data for the last 3 years, including only cities with population 5,000 and above)
| Jacinto City: | 2.5 |
| Galena Park: | 17.9 |
| Cloverleaf: | 0.6 |
| Channelview: | 55.4 |
| South Houston: | 1.1 |
| Pasadena: | 10.7 |
| Houston: | 33.1 |
| Deer Park: | 13.1 |
| Highlands: | 192.3 |
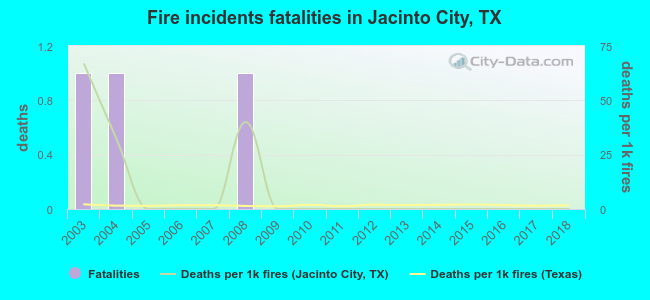 According to the data from the years 2003 - 2018 the average number of fire-related yearly deaths is 0. The highest number of deaths - 1 took place in 2003, and the lowest - 0 in 2005. The data has a decreasing trend.
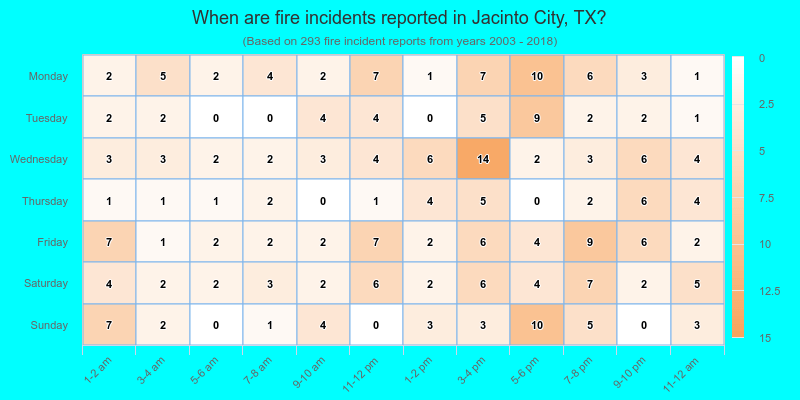
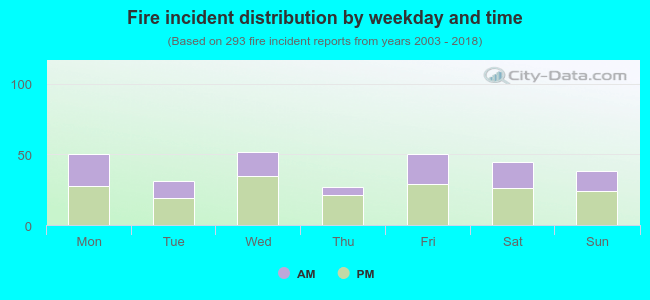 37.9% incidents where reported in the morning and 62.1% in the evening. The most fires (17.7%) took place on Wednesday, and the least (9.2%) on Thursday.
 According to the 293 fire incident reports from years 2003 - 2018 most fires (11.9%) took place during January, and the least (6.1%) in November.
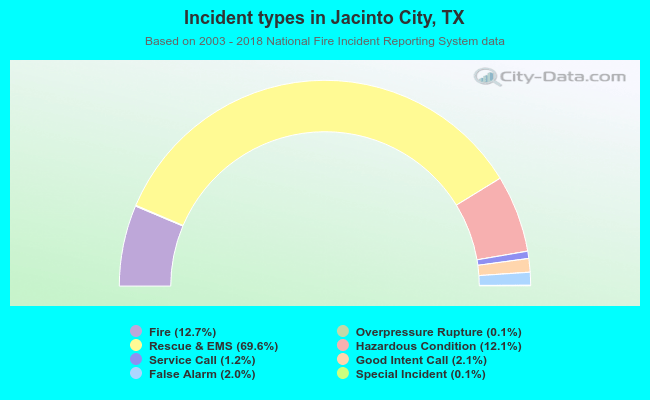 Out of all 2,305 cases reported during the years 2003 - 2018, the most belonged to the categories: Rescue & EMS (69.6%), Fire (12.7%), and Hazardous Condition (12.1%).
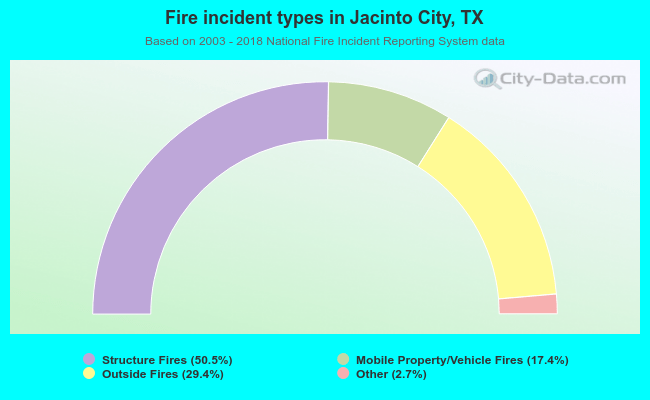 When looking into fire subcategories, the most incidents belonged to: Structure Fires (50.5%), and Outside Fires (29.4%).