| Fire incidents reported |
|---|
| Sreet name | Count |
|---|
| PINECREST RD | 18 | | TOWE STRING ROAD | 16 | | PINECREST ROAD | 12 | | ELKINS RD | 10 | | MAIN ST | 10 | | CHEROKEE TRAIL | 8 | | CRESTVIEW LN | 8 | | LAKEWOOD RD | 8 | | RIVER ROAD | 8 | | VANOVER LN | 8 | | DOG CREEK LN | 6 | | ELK LAKE LN | 6 | | SAW MILL CIRCLE | 6 | | TIONESTA DR | 6 | | TOWE STRING RD | 6 | | 172 LANDMARK ROAD | 4 | | 265 TOWE STRING RD | 4 | | 2824 APPALACHIAN HWY. | 4 | | 476 HATMAKER RIDGE RD | 4 | | 850 PINECREST RD | 4 | | APPALACHIAN HWY | 4 | | CLEAR LAKE DR | 4 | | CRUTCHFIELD LN | 4 | | EAGLE BLUFF | 4 | | EAGLE BLUFF RD | 4 |
| | | Fire incidents reported |
|---|
| Sreet name | Count |
|---|
| EAGLE BLUFF ROAD | 4 | | HATMAKER RIDGE | 4 | | HIGHLAND DR | 4 | | HOLLIFIELD DR | 4 | | INDIAN RIVER BOAT DOCK ROAD | 4 | | INDUSTRIAL PKY | 4 | | KENTUCKY ST | 4 | | LAKESIDE | 4 | | LANDFILL RD | 4 | | LANDMARK | 4 | | LANDMARK RD | 4 | | LAWSON LANE | 4 | | LEAF LN | 4 | | MCGHEE LN | 4 | | OVERLOOK LN | 4 | | PAT PLACE LANE | 4 | | PINE HOLLOW ROAD | 4 | | PONY DR | 4 | | RIVER RD | 4 | | SYCAMORE DR | 4 | | TOWESTRING RD | 4 | | TWIN HILLS | 4 | | 106 STONE HENGE LN. | 2 | | 113 FIRE DEPT LN | 2 | | |
|
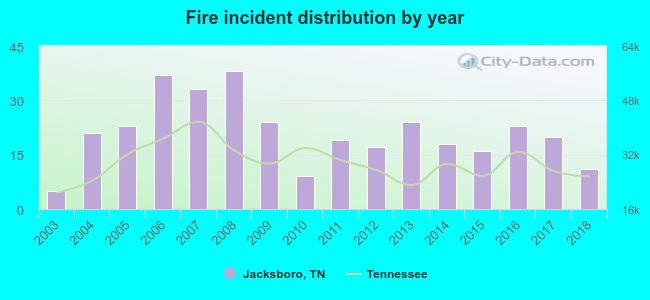 Based on the data from the years 2003 - 2018 the average number of fire incidents per year is 21. The highest number of fires - 38 took place in 2008, and the least - 5 in 2003. The data has a rising trend.
 37.3% incidents where reported in the morning and 62.7% in the evening. The most fires (19.2%) took place on Thursday, and the least (10.1%) on Tuesday.
 Based on the 338 fires from years 2003 - 2018 most fires (11.5%) took place during January, and the least (3.8%) in August.
 Out of all 568 cases reported during the years 2003 - 2018, the most belonged to the categories: Fire (59.5%), Rescue & EMS (14.3%), and Hazardous Condition (10.4%).
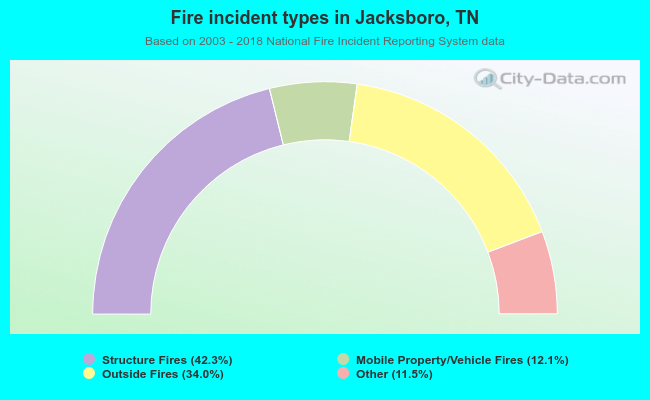 When looking into fire subcategories, the most incidents belonged to: Structure Fires (42.3%), and Outside Fires (34.0%).