Janesville: Fire Incidents, Minnesota (MN)
Where are fire incidents reported in Janesville, MN
Something went wrong! Please refresh the page.
|
| |||||||||||||||||||||||||||||||||||||||||||||||||||||||||||||||||||||||||||||||||||||||||||||||||||||||||||||
2002 - 2018 National Fire Incident Reporting System (NFIRS) incidents
- Incident types reported to NFIRS in Janesville, MN
- 77763.3%Rescue & EMS
- 31325.5%Fire
- 393.2%Hazardous Condition
- 393.2%Good Intent Call
- 282.3%False Alarm
- 131.1%Service Call
- 121.0%Overpressure Rupture
- 70.6%Severe Weather
- Fire incident types reported to NFIRS in Janesville, MN
- 12239.0%Outside Fires
- 10734.2%Structure Fires
- 4313.7%Mobile Property/Vehicle Fires
- 4113.1%Other
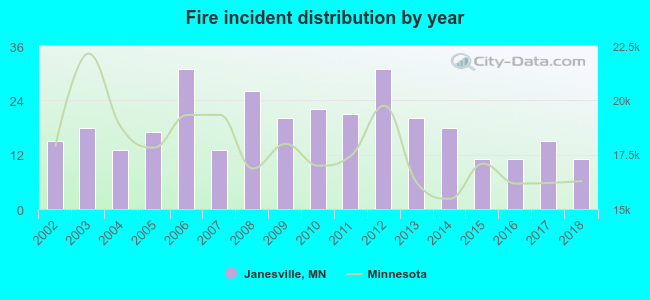 Based on the data from the years 2002 - 2018 the average number of fire incidents per year is 18. The highest number of fire incidents - 31 took place in 2006, and the least - 11 in 2015. The data has a dropping trend.
 27.2% incidents where reported in the morning and 72.8% in the evening. The most fires (17.3%) took place on Wednesday, and the least (10.2%) on Tuesday.
 Based on the 313 fires from years 2002 - 2018 most fires (17.3%) took place during October, and the least (4.2%) in August.
 Out of all 1,228 cases reported during the years 2002 - 2018, the most belonged to the categories: Rescue & EMS (63.3%), Fire (25.5%), and Hazardous Condition (3.2%).
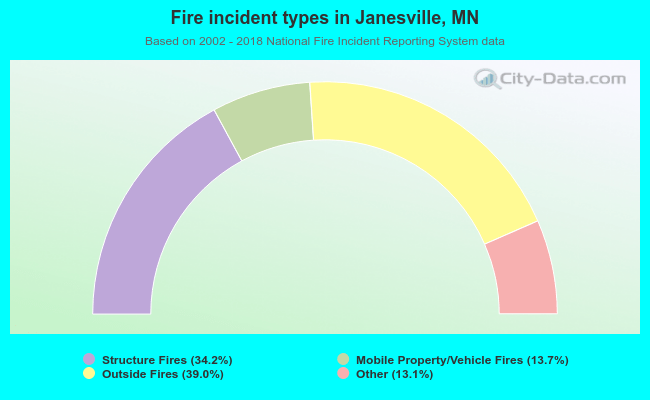 When looking into fire subcategories, the most reports belonged to: Outside Fires (39.0%), and Structure Fires (34.2%).