| Fire incidents reported |
|---|
| Sreet name | Count |
|---|
| FM 729 | 20 | | FM 726 | 16 | | HOLIDAY HARBOR DRIVE | 12 | | FORESTRIDGE DRIVE | 8 | | LAKESIDE DRIVE | 8 | | LULA LANE | 8 | | WATERWOOD LOOP | 8 | | AUTUMN WOODS DR | 6 | | AUTUMN WOODS DR. | 6 | | FM 134 | 6 | | HIGHPOINT DR | 6 | | KING STREET | 6 | | LAKE O THE PINES RD | 6 | | LAKESIDE DR. | 6 | | POST OAK DR | 6 | | APACHE TRAIL | 4 | | BULL FROG MARINA | 4 | | CHICASAW DR | 4 | | CORTEZ STREET | 4 | | DANIEL STREET | 4 | | DEER RUN ROAD | 4 | | FM 2208 | 4 | | GORMAN ROAD | 4 | | GREENHILLS LANE | 4 | | HWY 49 | 4 |
| | | Fire incidents reported |
|---|
| Sreet name | Count |
|---|
| HWY 59 | 4 | | JAMES STREET | 4 | | JOE DAVIS ROAD | 4 | | LAKESIDE DR | 4 | | LAKEVIEW DRIVE | 4 | | PINE HARBOR DR | 4 | | PINEY WOODS | 4 | | SANDY BEACH | 4 | | TAHITI | 4 | | TANGIERS | 4 | | TERRY LANE | 4 | | WHISPERING PINES | 4 | | 11300 HWY 59 N | 2 | | 134 | 2 | | 1762 RD | 2 | | 2208 | 2 | | BAKER BRIDGE RD | 2 | | BEAUTIFUL HILLS RD | 2 | | BEREA ROAD | 2 | | BIG CYPRESS MARINA RD | 2 | | BIG CYPRESS MARINA RD. | 2 | | BLACKJACK | 2 | | BLACKJACK RD | 2 | | BOIS D ARC RD | 2 | | |
|
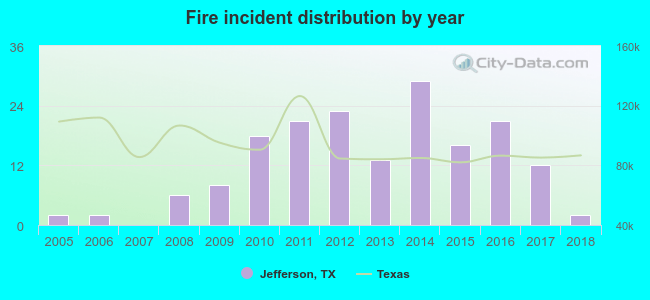 According to the data from the years 2005 - 2018 the average number of fires per year is 12. The highest number of reported fires - 29 took place in 2014, and the least - 0 in 2007. The data has a constant trend.
 20.8% incidents where reported in the morning and 79.2% in the evening. The most fires (17.3%) took place on Tuesday, and the least (8.7%) on Thursday.
 Based on the 173 fire incident reports from years 2005 - 2018 most fires (17.3%) took place during January, and the least (2.3%) in November.
 Out of all 384 cases reported during the years 2005 - 2018, the most belonged to the categories: Overpressure Rupture (47.7%), Fire (45.1%), and Rescue & EMS (2.1%).
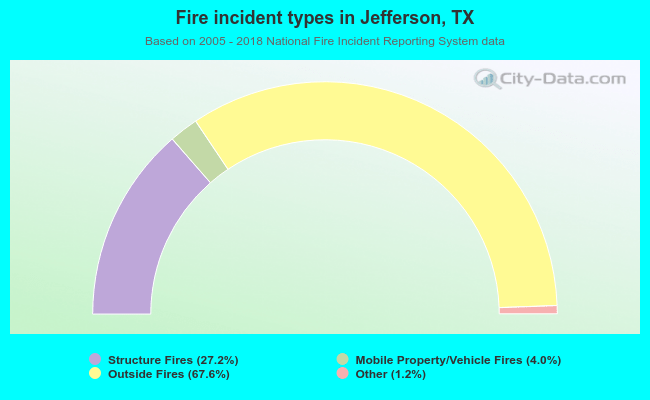 When looking into fire subcategories, the most incidents belonged to: Outside Fires (67.6%), and Structure Fires (27.2%).