Jeffersonville: Fire Incidents, Indiana (IN)
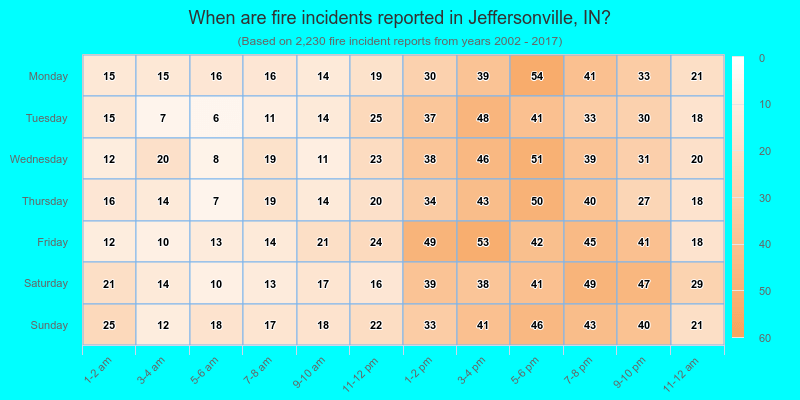
Where are fire incidents reported in Jeffersonville, IN
Something went wrong! Please refresh the page.
| Fire incidents reported | |
|---|---|
| Sreet name | Count |
| 10TH ST | 250 |
| 10TH. ST | 126 |
| COURT AVE | 102 |
| MARKET ST | 92 |
| WALL ST | 90 |
| MAPLE ST | 88 |
| HWY. 62 | 70 |
| HAMBURG PIKE | 66 |
| MIDDLE RD | 62 |
| SPRING ST | 62 |
| UTICA PIKE | 60 |
| 8TH. ST | 50 |
| PORT RD | 48 |
| ALLISON LA | 46 |
| CHARLESTOWN PIKE | 42 |
| RIVERSIDE DR | 42 |
| CHESTNUT ST | 38 |
| WEBSTER BLVD | 38 |
| 10TH | 36 |
| COLONIAL PARK DR | 36 |
| MECHANIC ST | 34 |
| VILLAGE GREEN BLVD | 34 |
| 8TH ST | 32 |
| CHARLESTOWN AVE | 32 |
| 7TH. ST | 30 |
| ARMSTRONG CT | 30 |
| ALLISON LANE | 28 |
| HOLMANS LA | 28 |
| 9TH. ST | 26 |
| EASTERN BLVD | 26 |
| Other | 486 |
2002 - 2017 National Fire Incident Reporting System (NFIRS) incidents
- Incident types reported to NFIRS in Jeffersonville, IN
- 3,43735.1%Rescue & EMS
- 2,23022.8%Fire
- 2,16722.1%Hazardous Condition
- 7467.6%False Alarm
- 6927.1%Good Intent Call
- 4524.6%Service Call
- 420.4%Overpressure Rupture
- 260.3%Special Incident
- Fire incident types reported to NFIRS in Jeffersonville, IN
- 98043.9%Outside Fires
- 68530.7%Structure Fires
- 34715.6%Mobile Property/Vehicle Fires
- 2189.8%Other
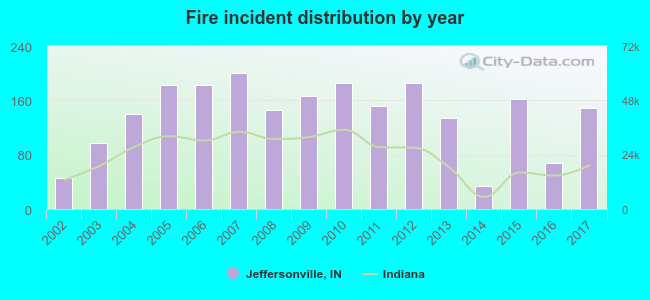 Based on the data from the years 2002 - 2017 the average number of fires per year is 139. The highest number of fire incidents - 200 took place in 2007, and the least - 34 in 2014. The data has an increasing trend.
The average number of yearly fire incidents per 10k residents in Jeffersonville, IN compared to nearest cities:
(Note: Based on data for the last 3 years, including only cities with population 5,000 and above)
| Jeffersonville: | 15.8 |
| Clarksville: | 2.3 |
| New Albany: | 19.7 |
| Sellersburg: | 36.8 |
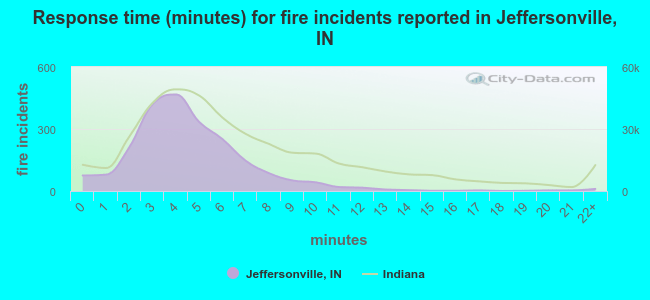 The median response time based on all reported fire incidents is 4 minutes. This is lower than the Indiana median value.
The median response time in Jeffersonville, IN compared to nearest cities:
(Note: Based on data for all years, including only cities with at least 500 fire incidents)
| Jeffersonville: | 4 minutes |
| Clarksville: | 4 minutes |
| New Albany: | 4 minutes |
| Sellersburg: | 6 minutes |
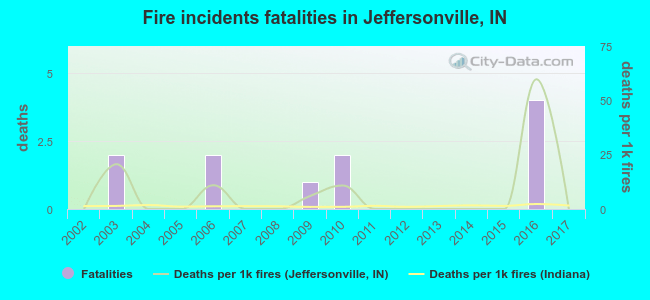 Based on the data from the years 2002 - 2017 the average number of fire-related fatalities per year is 1. The highest number of deaths - 4 took place in 2016, and the lowest - 0 in 2002. The data has a constant trend.
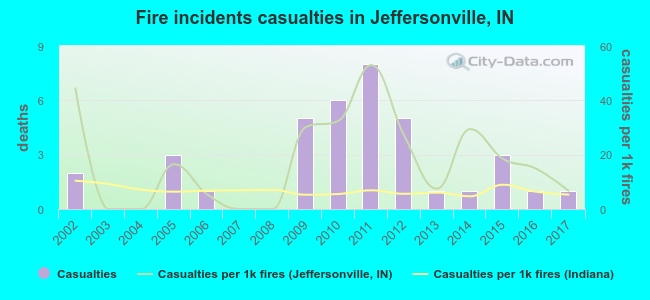 According to the reports from the years 2002 - 2017 the average number of fire-related casualties per year is 2. The highest number of reported casualties - 8 took place in 2011, and the lowest - 0 in 2003. The data has a declining trend.
The average number of casualties per 1,000 fires is 18. This indicator was the highest - 53 in 2011, and the lowest 0 in 2003. The trend for casualties per 1,000 incidents is dropping. Compared to the Indiana value the number of injuries per 1,000 fires is much higher.
According to the reports from the years 2002 - 2017 the average number of fire-related casualties per year is 2. The highest number of reported casualties - 8 took place in 2011, and the lowest - 0 in 2003. The data has a declining trend.
The average number of casualties per 1,000 fires is 18. This indicator was the highest - 53 in 2011, and the lowest 0 in 2003. The trend for casualties per 1,000 incidents is dropping. Compared to the Indiana value the number of injuries per 1,000 fires is much higher.Casualties per 1,000 incidents in Jeffersonville, IN compared to nearest cities:
(Note: Based on data for all years, including only cities with at least 500 fire incidents)
| Jeffersonville: | 16.6 |
| Clarksville: | 5.2 |
| New Albany: | 31.1 |
| Sellersburg: | 10.5 |
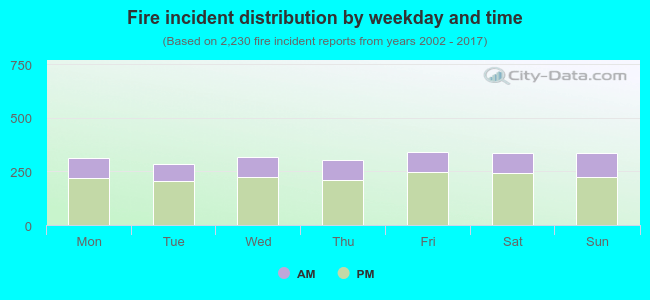 29.3% incidents where reported in the morning and 70.7% in the evening. The most fires (15.3%) took place on Friday, and the least (12.8%) on Tuesday.
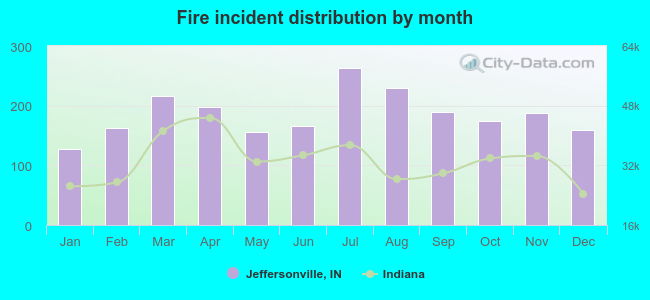 Based on the 2,230 fires from years 2002 - 2017 most fires (11.8%) took place during July, and the least (5.7%) in January.
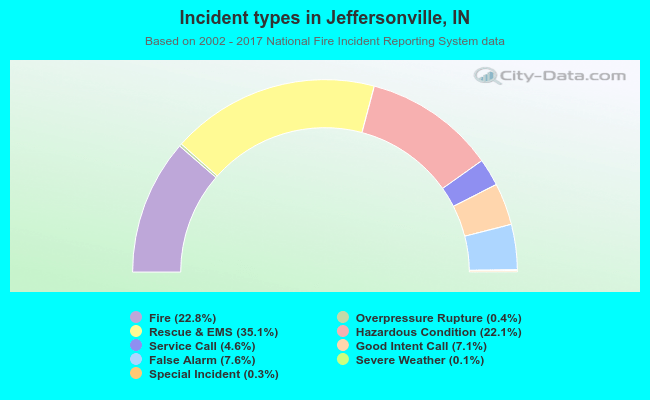 Out of all 9,800 cases reported during the years 2002 - 2017, the most belonged to the categories: Rescue & EMS (35.1%), Fire (22.8%), and Hazardous Condition (22.1%).
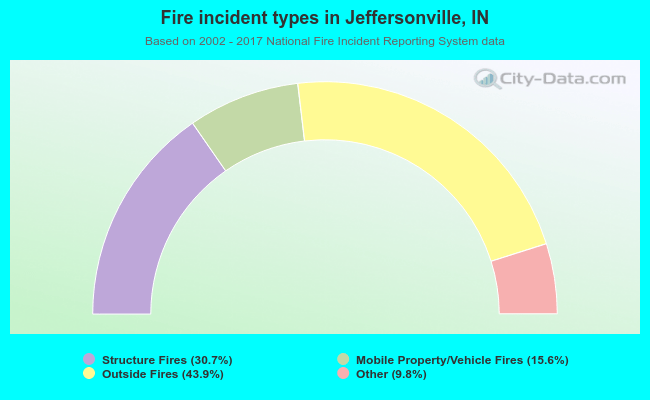 When looking into fire subcategories, the most incidents belonged to: Outside Fires (43.9%), and Structure Fires (30.7%).