| Fire incidents reported |
|---|
| Sreet name | Count |
|---|
| MAIN ST | 72 | | KY HIGHWAY 213 | 42 | | KY HIGHWAY 1050 | 36 | | LEVEE RD | 32 | | KY HIGHWAY 599 | 22 | | SAWMILL RD | 22 | | WILLOUGHBY TOWN RD | 16 | | BEDFORD RD | 14 | | NEW CUT RD | 14 | | CALK LAKE RD | 12 | | SCIENCE RIDGE RD | 12 | | ASA MEANS RD | 10 | | FOX RD | 10 | | OREAR RD | 10 | | TOWN BRANCH RD | 10 | | 360 TABOR ROAD | 8 | | BELL FARM RD | 8 | | LOWER SPRUCE RD | 8 | | REFFITT RD | 8 | | STEELE RD | 8 | | BUFFALO TRACE DR | 6 | | FOX LANE RD | 6 | | HWY 213 SOUTH | 6 | | OLD KY HIGHWAY 11 | 6 | | PINE HILL SPUR | 6 |
| | | Fire incidents reported |
|---|
| Sreet name | Count |
|---|
| SHELBY LN | 6 | | SILVER RIDGE RD | 6 | | SPRUCE VALLEY LN | 6 | | TABOR RD | 6 | | WARE CHAPEL RD | 6 | | BLAKE DR | 4 | | CHAMBERS LN | 4 | | CLAY LICK RD | 4 | | CUNNINGHAM LN | 4 | | DOUBLE GATE RD | 4 | | FAY ST | 4 | | FOY HIGHLEY RD | 4 | | FULLER RD | 4 | | HARPER RIDGE RD | 4 | | JACOB LN | 4 | | LOVELY LN | 4 | | MARTIN LN | 4 | | MCFARLAND LN | 4 | | MONTGOMERY RD | 4 | | MYERS CEMETARY RD | 4 | | NORMAN RD | 4 | | PATTON RD | 4 | | PRATER LN | 4 | | RUSS WILLOUGHBY RD | 4 | | |
|
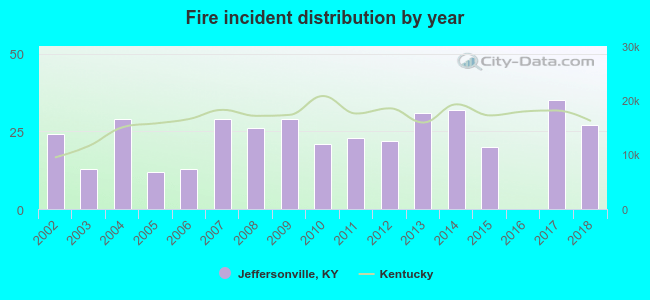 According to the data from the years 2002 - 2018 the average number of fires per year is 23. The highest number of fire incidents - 35 took place in 2017, and the least - 0 in 2016. The data has a rising trend.
 27.5% incidents where reported in the morning and 72.5% in the evening. The most fires (16.8%) took place on Saturday, and the least (12.4%) on Thursday.
 According to the 386 reports from years 2002 - 2018 most fires (16.8%) took place during March, and the least (4.7%) in December.
 Out of all 1,201 cases reported during the years 2002 - 2018, the most belonged to the categories: Rescue & EMS (39.4%), Fire (32.1%), and Good Intent Call (14.2%).
 When looking into fire subcategories, the most incidents belonged to: Outside Fires (39.1%), and Structure Fires (36.5%).