| Fire incidents reported |
|---|
| Sreet name | Count |
|---|
| MAIN ST | 58 | | BRIDGE ST | 42 | | CANYON BLVD | 26 | | HWY 26 HWY | 26 | | HWY 26 | 12 | | VALLEY VIEW DR | 12 | | 395 HWY | 8 | | DOG CREEK RD | 8 | | 26 HWY | 6 | | 7TH ST | 6 | | BOULDER LN | 6 | | BRENT ST | 6 | | BRIDGE STREET | 6 | | CANYON CREEK | 6 | | HILLCREST DR | 6 | | S CANYON BLVD | 6 | | TERRANCE RD | 6 | | WEST BENCH RD | 6 | | 4TH ST | 4 | | BUMPY RD | 4 | | CANYON CREEK COMPLEX | 4 | | CHAROLAIS HEIGHTS | 4 | | CHAROLAIS HTS | 4 | | DAYTON | 4 | | DIPPER RD | 4 |
| | | Fire incidents reported |
|---|
| Sreet name | Count |
|---|
| E MAIN ST | 4 | | FERGUSON RD | 4 | | FORD RD | 4 | | HILLCREST RD | 4 | | HWY 395 | 4 | | HWY 395 HWY | 4 | | JOHN DAY | 4 | | JOHN DAY OREGON | 4 | | MARKS CREEK RD | 4 | | MARYSVILLE RD | 4 | | PATTERSON BRIDGE RD | 4 | | SUNSET LN, WEST BENCH | 4 | | W MAIN ST | 4 | | W MAIN ST | 4 | | WILDERNESS RD | 4 | | 2ND ST | 2 | | 3 MM MARYSVILLE RD | 2 | | 3 RD ST | 2 | | 395 MP 5 HWY | 2 | | 3RD ST | 2 | | 5 MI W OF MT VERNON HWY 26 | 2 | | 6TH AND SW BRENT | 2 | | 9 TH ST | 2 | | 9TH ST | 2 | | |
|
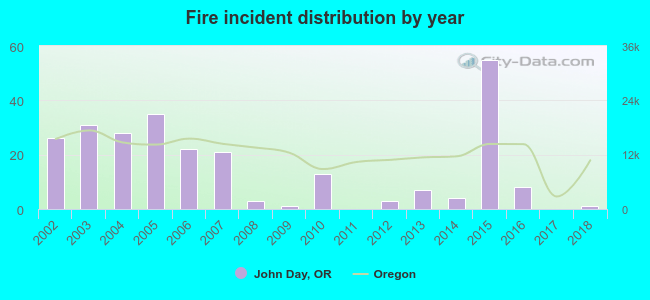 Based on the data from the years 2002 - 2018 the average number of fires per year is 15. The highest number of fires - 55 took place in 2015, and the least - 0 in 2011. The data has a decreasing trend.
 26.4% incidents where reported in the morning and 73.6% in the evening. The most fires (19.8%) took place on Saturday, and the least (7.0%) on Tuesday.
 According to the 258 incident reports from years 2002 - 2018 most fires (23.6%) took place during August, and the least (3.1%) in May.
 Out of all 304 cases reported during the years 2002 - 2018, the most belonged to the categories: Fire (84.9%), Service Call (13.2%), and Rescue & EMS (1.3%).
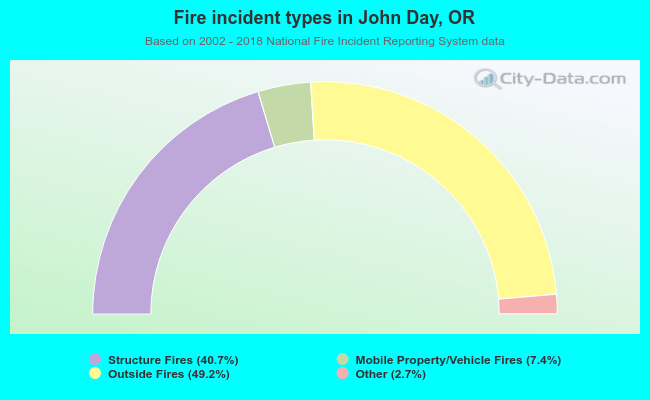 When looking into fire subcategories, the most incidents belonged to: Outside Fires (49.2%), and Structure Fires (40.7%).