Johnson: Fire Incidents, Arkansas (AR)
Where are fire incidents reported in Johnson, AR
Something went wrong! Please refresh the page.
|
| |||||||||||||||||||||||||||||||||||||||||||||||||||||||||||||||||||||||||||||||||||||||||||||||||||||||||||||
2002 - 2018 National Fire Incident Reporting System (NFIRS) incidents
- Incident types reported to NFIRS in Johnson, AR
- 1,05152.0%Rescue & EMS
- 31515.6%Fire
- 20810.3%Good Intent Call
- 1547.6%False Alarm
- 1527.5%Service Call
- 1396.9%Hazardous Condition
- Fire incident types reported to NFIRS in Johnson, AR
- 15348.6%Outside Fires
- 8827.9%Structure Fires
- 6721.3%Mobile Property/Vehicle Fires
- 72.2%Other
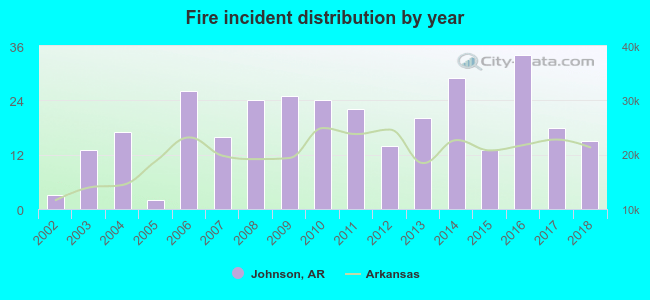 Based on the data from the years 2002 - 2018 the average number of fires per year is 19. The highest number of fire incidents - 34 took place in 2016, and the least - 2 in 2005. The data has a rising trend.
 34.3% incidents where reported in the morning and 65.7% in the evening. The most fires (17.1%) took place on Friday, and the least (9.5%) on Sunday.
 Based on the 315 fire incident reports from years 2002 - 2018 most fires (12.7%) took place during January, and the least (5.7%) in October.
 Out of all 2,022 cases reported during the years 2002 - 2018, the most belonged to the categories: Rescue & EMS (52.0%), Fire (15.6%), and Good Intent Call (10.3%).
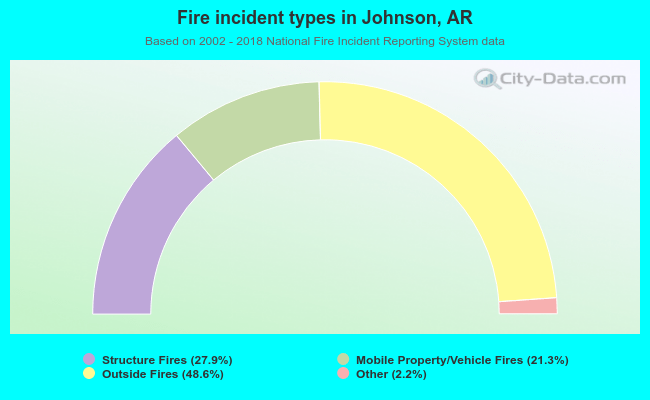 When looking into fire subcategories, the most incidents belonged to: Outside Fires (48.6%), and Structure Fires (27.9%).