| Fire incidents reported |
|---|
| Sreet name | Count |
|---|
| 337 COLLEGE HILL | 10 | | MAIN STREET | 6 | | RIVER ROAD EAST | 6 | | ROUTE 15 | 6 | | 1066 VT RTE 100C | 4 | | 1225 BEN OBER RD | 4 | | 18 MOUNTAIN VIEW LOOP | 4 | | 21 LOWER MAIN STREET W | 4 | | 282 LOWER MAIN STREET | 4 | | 288 RAILROAD STREET | 4 | | 454 CODDING HOLLOW RD | 4 | | 954 CLAY HILL RD | 4 | | 993 VT RTE 15 | 4 | | 993 VT RTE 15E | 4 | | COLLEGE HILL RD | 4 | | MAIN ST | 4 | | ROCKY ROAD | 4 | | RT 100C | 4 | | VT RT 100C | 4 | | VT RT 15 | 4 | | VT RTE 100 C | 4 | | VT RTE 15 EAST | 4 | | WHITCOMB ISLAND ROAD | 4 | | 100 SCHOOL ST | 2 | | 1007 FOOTE BROOK RD | 2 |
| | | Fire incidents reported |
|---|
| Sreet name | Count |
|---|
| 100C RT | 2 | | 1019 WATERMAN RD | 2 | | 1029 CODDING HOLLOW | 2 | | 1120 OBER HILL RD | 2 | | 1138 WATERMAN RD | 2 | | 12 COLLINS HILL RD. | 2 | | 12 LOWER MAIN ST | 2 | | 124 GOULD HILL RD | 2 | | 1248 OBER HILL RD | 2 | | 13 MUDGET HILL ROAD | 2 | | 131 LOWER MAIN STREET WEST | 2 | | 1375 PLOT RD | 2 | | 1396 COLLINS HILL RD | 2 | | 141 GIHON LANE | 2 | | 1411 WILSON RD | 2 | | 1461 RIVER RD E | 2 | | 1528 RIVER RD E | 2 | | 153 CLARK AVE | 2 | | 1768 UPPER FRENCH HILL | 2 | | 1844 RTE 100C | 2 | | 1990 VT RT 15 W | 2 | | 1995 VT RT 15 WEST | 2 | | 201 UPPER FRENCH HILL | 2 | | 2066 RIVER RD EAST | 2 | | |
|
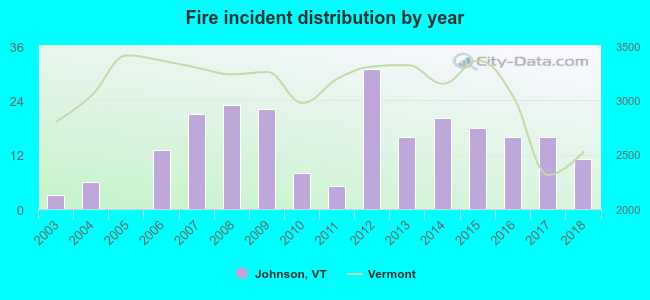 According to the data from the years 2003 - 2018 the average number of fire incidents per year is 14. The highest number of fire incidents - 31 took place in 2012, and the least - 0 in 2005. The data has an increasing trend.
 34.5% incidents where reported in the morning and 65.5% in the evening. The most fires (19.2%) took place on Thursday, and the least (10.5%) on Wednesday.
 Based on the 229 incident reports from years 2003 - 2018 most fires (14.4%) took place during April, and the least (3.9%) in October.
 Out of all 683 cases reported during the years 2003 - 2018, the most belonged to the categories: Fire (33.5%), Overpressure Rupture (18.2%), and Rescue & EMS (16.5%).
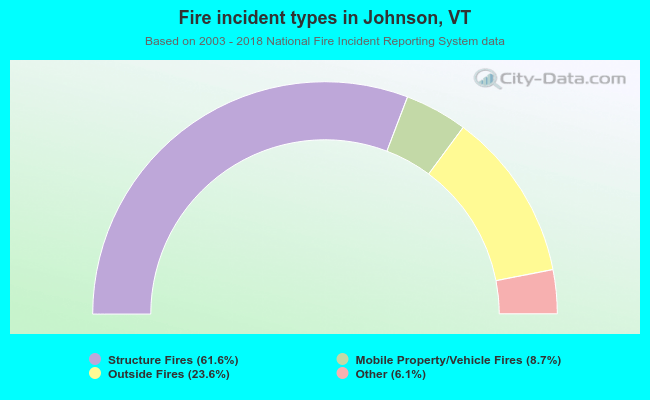 When looking into fire subcategories, the most reports belonged to: Structure Fires (61.6%), and Outside Fires (23.6%).