Jonesboro: Fire Incidents, Arkansas (AR)
Where are fire incidents reported in Jonesboro, AR
Something went wrong! Please refresh the page.
| Fire incidents reported | |
|---|---|
| Sreet name | Count |
| CARAWAY RD | 408 |
| HIGHLAND DR | 362 |
| JOHNSON AVE | 344 |
| NETTLETON AVE | 324 |
| CHURCH ST | 246 |
| PARKER RD | 216 |
| STADIUM BLVD | 190 |
| MATTHEWS AVE | 174 |
| 141 HWY | 166 |
| SOUTHWEST DR | 162 |
| HARRISBURG RD | 154 |
| HUNTINGTON AVE | 138 |
| AGGIE RD | 136 |
| JOE N MARTIN EXPY | 130 |
| PATRICK ST | 130 |
| GEE ST | 124 |
| BELT ST | 116 |
| MAIN ST | 116 |
| CULBERHOUSE ST | 114 |
| WASHINGTON AVE | 112 |
| CR 780 | 110 |
| ARROWHEAD FARM RD | 108 |
| BRIDGE ST | 96 |
| DAN AVE | 96 |
| WOODSPRINGS RD | 82 |
| FISHER ST | 80 |
| CULBERHOUSE | 78 |
| OLD GREENSBORO RD | 78 |
| FLINT ST | 76 |
| AIRPORT RD | 74 |
| Other | 5,451 |
2002 - 2018 National Fire Incident Reporting System (NFIRS) incidents
- Incident types reported to NFIRS in Jonesboro, AR
- 11,36337.3%Rescue & EMS
- 10,19133.5%Fire
- 3,24510.7%False Alarm
- 2,5068.2%Hazardous Condition
- 1,6965.6%Good Intent Call
- 1,2814.2%Service Call
- 990.3%Overpressure Rupture
- 330.1%Severe Weather
- 330.1%Special Incident
- Fire incident types reported to NFIRS in Jonesboro, AR
- 5,76056.5%Outside Fires
- 3,06330.1%Structure Fires
- 1,25712.3%Mobile Property/Vehicle Fires
- 1111.1%Other
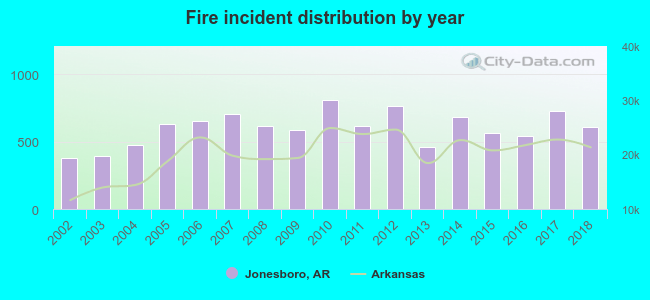 Based on the data from the years 2002 - 2018 the average number of fire incidents per year is 599. The highest number of reported fire incidents - 805 took place in 2010, and the least - 378 in 2002. The data has a growing trend.
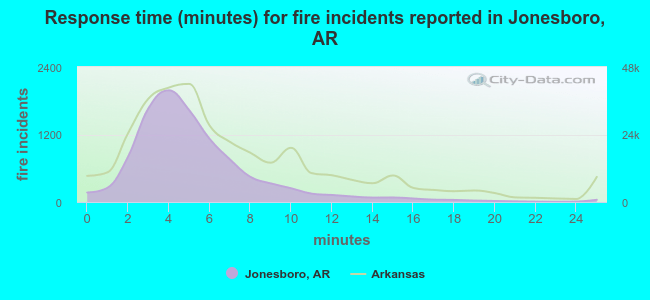 The median response time based on all reported fire incidents is 5 minutes. This is lower than the Arkansas median value.
The median response time in Jonesboro, AR compared to nearest cities:
(Note: Based on data for all years, including only cities with at least 500 fire incidents)
| Jonesboro: | 5 minutes |
| Bono: | 8 minutes |
| Trumann: | 3 minutes |
| Harrisburg: | 8 minutes |
| Paragould: | 4 minutes |
| Hoxie: | 6 minutes |
| Walnut Ridge: | 4 minutes |
| Marked Tree: | 6 minutes |
| Pocahontas: | 5 minutes |
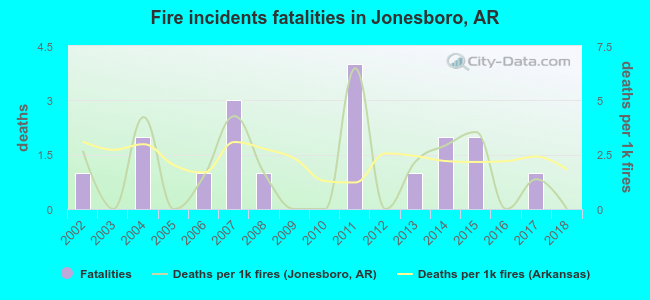 According to the reports from the years 2002 - 2018 the average number of fire-related yearly deaths is 1. The highest number of reported deaths - 4 took place in 2011, and the lowest - 0 in 2003. The data has a declining trend.
The average number of fatalities per 1,000 fires is 2. This indicator was the highest - 6 in 2011, and the lowest 0 in 2003. The trend for fatalities per 1,000 fires is decreasing. Compared to the Arkansas value the number of fatalities per 1,000 fires is lower.
According to the reports from the years 2002 - 2018 the average number of fire-related yearly deaths is 1. The highest number of reported deaths - 4 took place in 2011, and the lowest - 0 in 2003. The data has a declining trend.
The average number of fatalities per 1,000 fires is 2. This indicator was the highest - 6 in 2011, and the lowest 0 in 2003. The trend for fatalities per 1,000 fires is decreasing. Compared to the Arkansas value the number of fatalities per 1,000 fires is lower.Deaths per 1,000 incidents in Jonesboro, AR compared to nearest cities:
(Note: Based on data for all years, including only cities with at least 2,500 fire incidents)
| Jonesboro: | 1.8 |
| Paragould: | 4.6 |
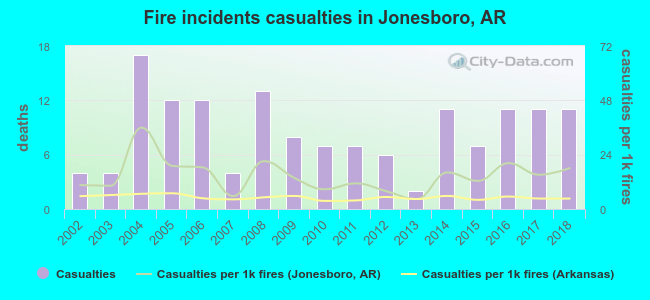 Based on the reports from the years 2002 - 2018 the average number of fire-related casualties per year is 9. The highest number of reported injuries - 17 took place in 2004, and the lowest - 2 in 2013. The data has a growing trend.
The average number of casualties per 1,000 fire incidents is 15. This indicator was the highest - 36 in 2004, and the lowest 4 in 2013. The trend for casualties per 1,000 incidents is increasing. Compared to the state value the number of injuries per 1,000 fires is much higher.
Based on the reports from the years 2002 - 2018 the average number of fire-related casualties per year is 9. The highest number of reported injuries - 17 took place in 2004, and the lowest - 2 in 2013. The data has a growing trend.
The average number of casualties per 1,000 fire incidents is 15. This indicator was the highest - 36 in 2004, and the lowest 4 in 2013. The trend for casualties per 1,000 incidents is increasing. Compared to the state value the number of injuries per 1,000 fires is much higher.Casualties per 1,000 incidents in Jonesboro, AR compared to nearest cities:
(Note: Based on data for all years, including only cities with at least 500 fire incidents)
| Jonesboro: | 14.4 |
| Bono: | 0.0 |
| Trumann: | 0.5 |
| Harrisburg: | 0.0 |
| Paragould: | 11.7 |
| Hoxie: | 1.8 |
| Walnut Ridge: | 0.0 |
| Marked Tree: | 5.1 |
| Pocahontas: | 1.2 |
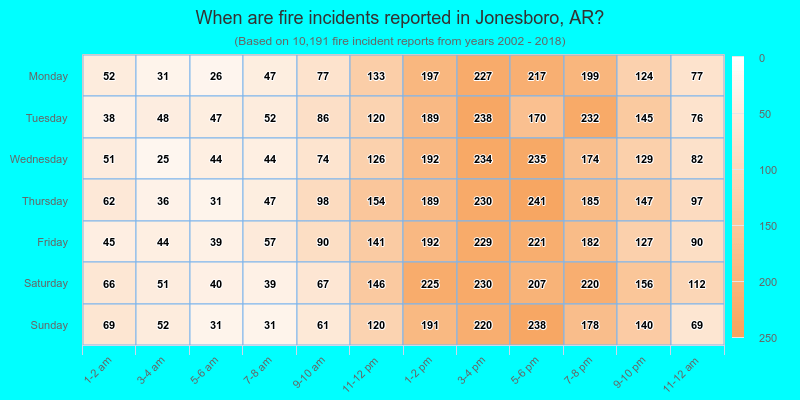
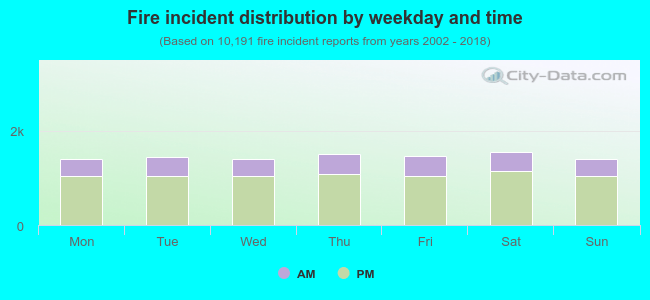 26.9% incidents where reported in the morning and 73.1% in the evening. The most fires (15.3%) took place on Saturday, and the least (13.7%) on Sunday.
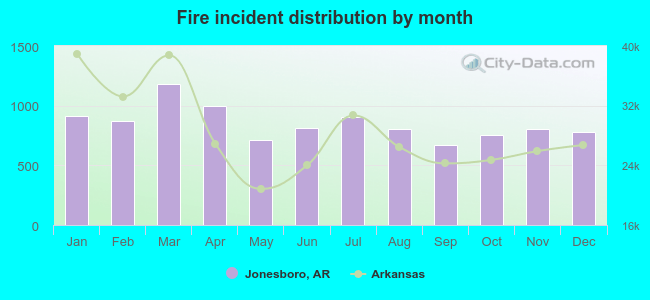 Based on the 10,191 fire incident reports from years 2002 - 2018 most fires (11.6%) took place during March, and the least (6.5%) in September.
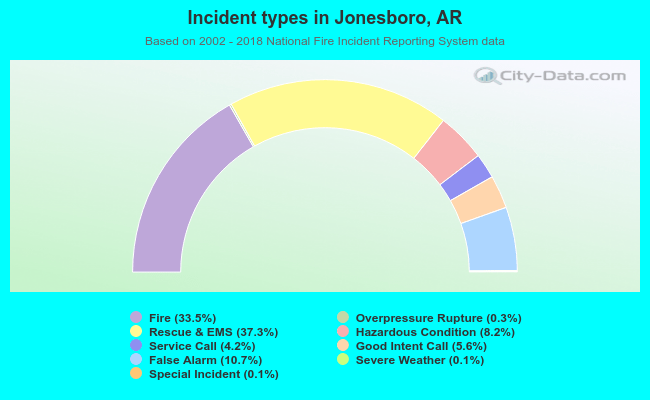 Out of all 30,447 cases reported during the years 2002 - 2018, the most belonged to the categories: Rescue & EMS (37.3%), Fire (33.5%), and False Alarm (10.7%).
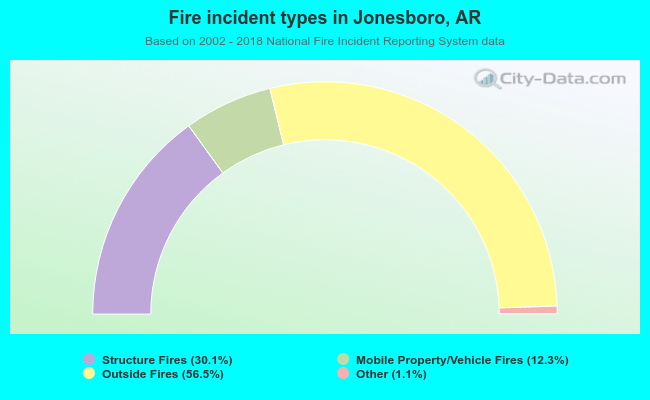 When looking into fire subcategories, the most incidents belonged to: Outside Fires (56.5%), and Structure Fires (30.1%).