Jonesville: Fire Incidents, Louisiana (LA)
Where are fire incidents reported in Jonesville, LA
Something went wrong! Please refresh the page.
|
| |||||||||||||||||||||||||||||||||||||||||||||||||||||||||||||||||||||||||||||||||||||||||||||||||||||||||||||
| Other | 55 | |||||||||||||||||||||||||||||||||||||||||||||||||||||||||||||||||||||||||||||||||||||||||||||||||||||||||||||
2002 - 2018 National Fire Incident Reporting System (NFIRS) incidents
- Incident types reported to NFIRS in Jonesville, LA
- 35787.1%Fire
- 276.6%Rescue & EMS
- 194.6%Hazardous Condition
- 41.0%Good Intent Call
- 20.5%Severe Weather
- 10.2%False Alarm
- Fire incident types reported to NFIRS in Jonesville, LA
- 19253.8%Structure Fires
- 8323.2%Outside Fires
- 6919.3%Mobile Property/Vehicle Fires
- 133.6%Other
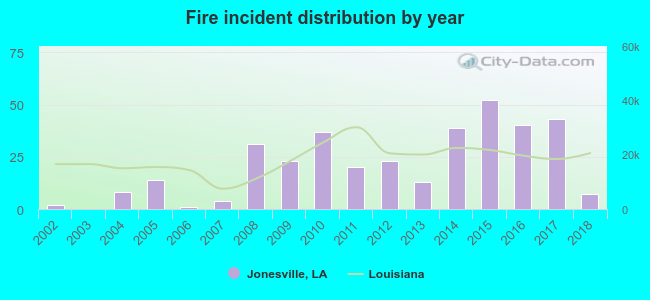 According to the data from the years 2002 - 2018 the average number of fires per year is 21. The highest number of reported fire incidents - 52 took place in 2015, and the least - 0 in 2003. The data has an increasing trend.
 31.1% incidents where reported in the morning and 68.9% in the evening. The most fires (15.1%) took place on Monday, and the least (12.3%) on Friday.
 According to the 357 incident reports from years 2002 - 2018 most fires (13.4%) took place during January, and the least (4.5%) in June.
 Out of all 410 cases reported during the years 2002 - 2018, the most belonged to the categories: Fire (87.1%), Overpressure Rupture (6.6%), and Rescue & EMS (4.6%).
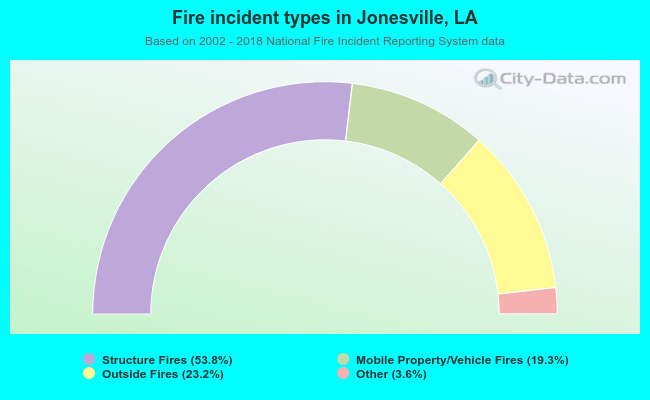 When looking into fire subcategories, the most incidents belonged to: Structure Fires (53.8%), and Outside Fires (23.2%).