| Fire incidents reported |
|---|
| Sreet name | Count |
|---|
| WILDERNESS RD | 10 | | ALT 58 | 8 | | SUGAR RUN RD | 8 | | FLANARY BRIDGE RD | 6 | | HURRICANE RD | 6 | | MAIN STREET | 6 | | RT 58 | 6 | | RT 612 | 6 | | ST RT 616 | 6 | | CAMP GROUND ROAD | 4 | | CURT RUSSELL RD | 4 | | DEPOT HILL RD | 4 | | HURRICANE BRIDGE | 4 | | JONESVILLE MIDDLE SCHOOL | 4 | | OCOONITA RD | 4 | | RT 2 | 4 | | RT 621 | 4 | | RUSSELL SAWMILL RD | 4 | | RUSSELL ST | 4 | | ST RT 58 | 4 | | ST RT 70 | 4 | | VETERANS MEMORIAL HWY | 4 | | 1ST | 2 | | 4529 CHALET VILLAGE | 2 | | 612 | 2 |
| | | Fire incidents reported |
|---|
| Sreet name | Count |
|---|
| 612 WALLENS CREEK | 2 | | ALT 58 1 MILE E OF JVILLE | 2 | | ALT 58 EAST OF JONESVILLE | 2 | | ALT RT 58 1 MILE E OF JVILLE | 2 | | ALTERNATE 58 | 2 | | ALTERNATE58 | 2 | | BEECH GROVE RD | 2 | | BOX 146 | 2 | | BURNING WELL RD | 2 | | CABIN DR | 2 | | CAMPGROUND RD | 2 | | CAMPGROUND ROAD (652) | 2 | | CHAPEL GARDEN APTS | 2 | | CHAPPEL DR | 2 | | COLUMBO DR | 2 | | COOK AND RANDOLPH | 2 | | COONEY HOLLOW RD | 2 | | CRIMSON DR | 2 | | DALE ELDRIDGE RD | 2 | | FLANARY BRIDGE RD | 2 | | FLATWOODS SCH RD | 2 | | FRIENDSHIP HOLLOW RD | 2 | | GEORGE JONES RD | 2 | | HAGAN RD | 2 | | |
|
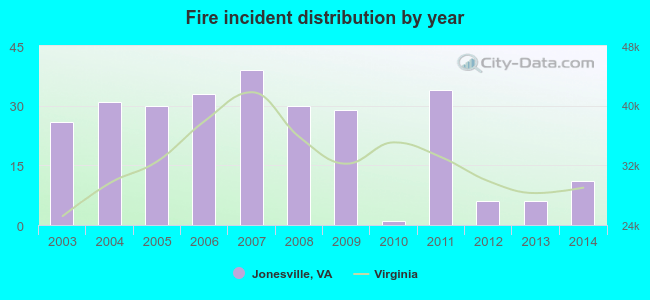 According to the data from the years 2003 - 2014 the average number of fires per year is 23. The highest number of fire incidents - 39 took place in 2007, and the least - 1 in 2010. The data has a declining trend.
 34.1% incidents where reported in the morning and 65.9% in the evening. The most fires (18.5%) took place on Thursday, and the least (10.9%) on Monday.
 Based on the 276 fire incidents from years 2003 - 2014 most fires (15.2%) took place during March, and the least (3.6%) in July.
 Out of all 429 cases reported during the years 2003 - 2014, the most belonged to the categories: Fire (64.3%), Rescue & EMS (31.0%), and Service Call (2.3%).
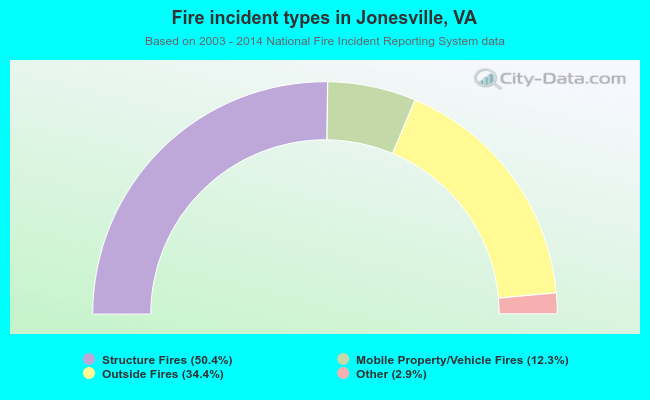 When looking into fire subcategories, the most reports belonged to: Structure Fires (50.4%), and Outside Fires (34.4%).