| Fire incidents reported |
|---|
| Sreet name | Count |
|---|
| HAWK MOUNTAIN RD | 10 | | INTERSTATE 78 | 10 | | LONG RD | 6 | | OLD PHILLY PKE | 6 | | ROUTE 143 | 6 | | COMMUNITY CENTER DR | 4 | | GOLDEN KEY RD | 4 | | HAWKFIELD RD | 4 | | KISTLER VALLEY RD | 4 | | LITTLE ROUND TOP RD | 4 | | MOUNTAIN RD | 4 | | MOUNTAIN ROAD | 4 | | OLD PHILLY PIKE | 4 | | PINE SWAMP RD | 4 | | PONDEROSA CT | 4 | | RHOADES RD | 4 | | RHOADES ROAD | 4 | | ROBIN HILL ROAD | 4 | | ROUTE 737 | 4 | | STAGECOACH ROAD | 4 | | 3461 WILLOW RUN RD | 2 | | 506 NURSERY RD | 2 | | 662 | 2 | | 737 RT | 2 | | ALBANY STREET | 2 |
| | | Fire incidents reported |
|---|
| Sreet name | Count |
|---|
| BLUE ROCKS RD | 2 | | BLUE ROCKS78 RD | 2 | | CREEK RD COMMUNITY CENTER DR | 2 | | DIETRICH VALLEY RD | 2 | | DOTTERER | 2 | | GEORGE RD | 2 | | GUN CLUB RD | 2 | | INTERSTATE 78 MM 38 EAST | 2 | | KEMPTON RD | 2 | | KISTLER VALLEY RD | 2 | | KRUMSVILLE | 2 | | LITTLE ROUND TOP RD | 2 | | LONG LANE RD | 2 | | LONG RD (78) | 2 | | LONG ROAD | 2 | | LOVERS LN | 2 | | LOWERS LN | 2 | | MOHN RD | 2 | | MOUNTAIN (77) | 2 | | MOUNTAIN RD | 2 | | MOUNTAIN RD (77) | 2 | | NEW SMITHVILLE RD | 2 | | OLD PHILADELPHIA RD | 2 | | OLD PHILLY PIKE | 2 | | |
|
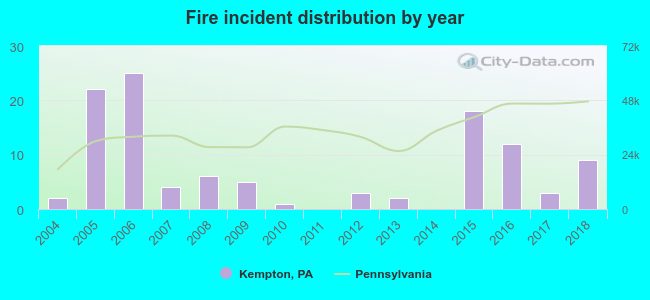 According to the data from the years 2004 - 2018 the average number of fires per year is 7. The highest number of fires - 25 took place in 2006, and the least - 0 in 2011. The data has an increasing trend.
 32.1% incidents where reported in the morning and 67.9% in the evening. The most fires (18.8%) took place on Monday, and the least (9.8%) on Tuesday.
 According to the 112 fire incidents from years 2004 - 2018 most fires (17.9%) took place during March, and the least (2.7%) in July.
 Out of all 494 cases reported during the years 2004 - 2018, the most belonged to the categories: Overpressure Rupture (48.0%), Fire (22.7%), and Rescue & EMS (13.6%).
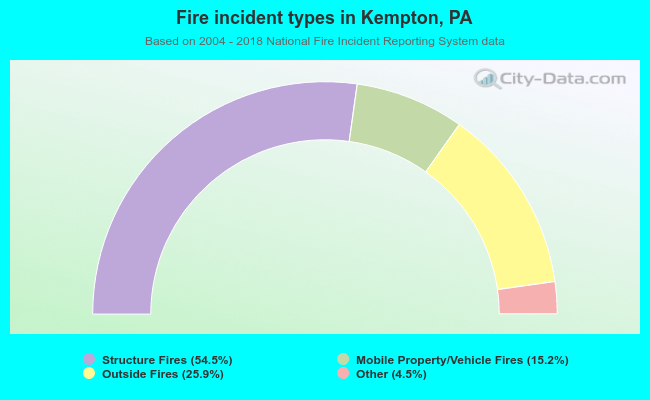 When looking into fire subcategories, the most reports belonged to: Structure Fires (54.5%), and Outside Fires (25.9%).