Kensington: Fire Incidents, Maryland (MD)
Where are fire incidents reported in Kensington, MD
Something went wrong! Please refresh the page.
|
| |||||||||||||||||||||||||||||||||||||||||||||||||||||||||||||||||||||||||||||||||||||||||||||||||||||||||||||
| Other | 55 | |||||||||||||||||||||||||||||||||||||||||||||||||||||||||||||||||||||||||||||||||||||||||||||||||||||||||||||
2004 - 2018 National Fire Incident Reporting System (NFIRS) incidents
- Incident types reported to NFIRS in Kensington, MD
- 8,36269.7%Rescue & EMS
- 1,0408.7%Hazardous Condition
- 9207.7%Good Intent Call
- 7716.4%Service Call
- 5714.8%False Alarm
- 3152.6%Fire
- 160.1%Special Incident
- Fire incident types reported to NFIRS in Kensington, MD
- 10934.6%Outside Fires
- 10031.7%Structure Fires
- 6721.3%Mobile Property/Vehicle Fires
- 3912.4%Other
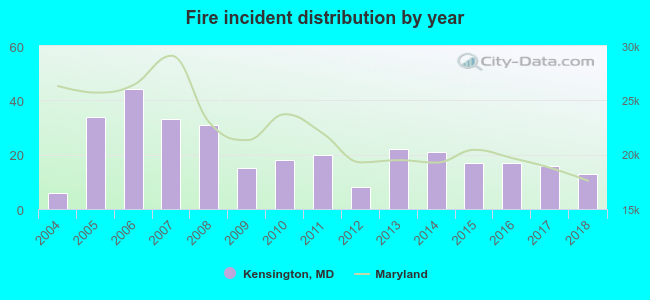 Based on the data from the years 2004 - 2018 the average number of fire incidents per year is 21. The highest number of fires - 44 took place in 2006, and the least - 6 in 2004. The data has a rising trend.
 According to the reports from the years 2004 - 2018 the average number of fire-related casualties per year is 1. The highest number of reported casualties - 5 took place in 2007, and the lowest - 0 in 2004. The data has a constant trend.
 27.9% incidents where reported in the morning and 72.1% in the evening. The most fires (16.5%) took place on Saturday, and the least (11.7%) on Tuesday.
 According to the 315 incident reports from years 2004 - 2018 most fires (11.4%) took place during April, and the least (5.7%) in February.
 Out of all 12,001 cases reported during the years 2004 - 2018, the most belonged to the categories: Rescue & EMS (69.7%), Hazardous Condition (8.7%), and Good Intent Call (7.7%).
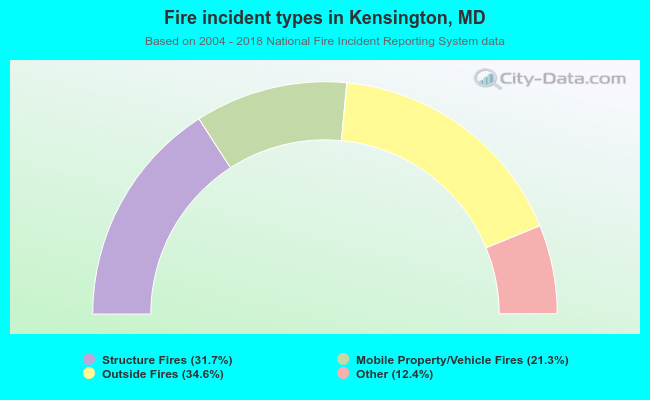 When looking into fire subcategories, the most reports belonged to: Outside Fires (34.6%), and Structure Fires (31.7%).