Kentland: Fire Incidents, Indiana (IN)
Where are fire incidents reported in Kentland, IN
Something went wrong! Please refresh the page.
|
| |||||||||||||||||||||||||||||||||||||||||||||||||||||||||||||||||||||||||||||||||||||||||||||||||||||||||||||
| Other | 17 | |||||||||||||||||||||||||||||||||||||||||||||||||||||||||||||||||||||||||||||||||||||||||||||||||||||||||||||
2002 - 2015 National Fire Incident Reporting System (NFIRS) incidents
- Incident types reported to NFIRS in Kentland, IN
- 18560.3%Fire
- 10734.9%Hazardous Condition
- 51.6%Rescue & EMS
- 51.6%Good Intent Call
- 31.0%False Alarm
- 20.7%Special Incident
- Fire incident types reported to NFIRS in Kentland, IN
- 7238.9%Structure Fires
- 6736.2%Outside Fires
- 2714.6%Other
- 1910.3%Mobile Property/Vehicle Fires
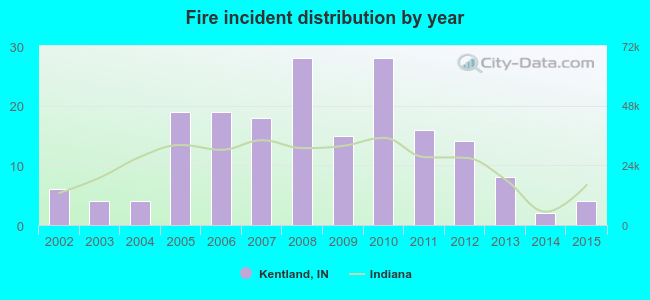 Based on the data from the years 2002 - 2015 the average number of fires per year is 13. The highest number of fire incidents - 28 took place in 2008, and the least - 2 in 2014. The data has a decreasing trend.
 35.7% incidents where reported in the morning and 64.3% in the evening. The most fires (18.9%) took place on Thursday, and the least (9.7%) on Wednesday.
 According to the 185 incident reports from years 2002 - 2015 most fires (13.5%) took place during March, and the least (3.2%) in January.
 Out of all 307 cases reported during the years 2002 - 2015, the most belonged to the categories: Fire (60.3%), Rescue & EMS (34.9%), and Overpressure Rupture (1.6%).
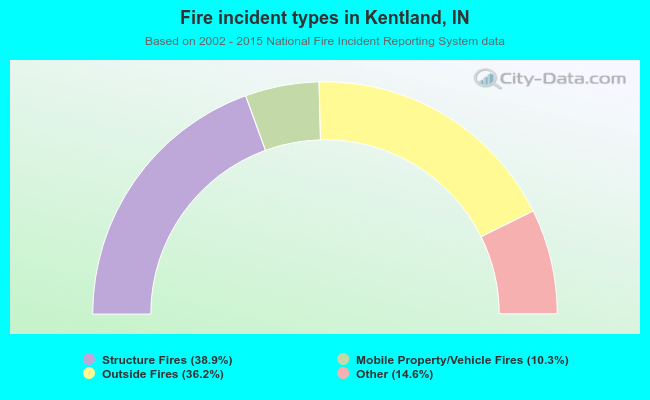 When looking into fire subcategories, the most incidents belonged to: Structure Fires (38.9%), and Outside Fires (36.2%).