| Fire incidents reported |
|---|
| Sreet name | Count |
|---|
| POPLAR | 22 | | MORELLA RD | 14 | | HWY 89 | 12 | | HWY 45 W | 8 | | HWY 45W | 8 | | OLD TURNPIKE RD | 8 | | 45 HWY | 6 | | COLLEGE ST | 6 | | FORKS RIVER RD | 6 | | TILGHMAN ST | 6 | | UNION GROVE ROAD | 6 | | BARNER ROAD | 4 | | BASELINE RD | 4 | | BASELINE RD RD | 4 | | BECTON | 4 | | COLLEGE STREET | 4 | | CONCORD RD | 4 | | FORKS RIVER ROAD | 4 | | FRONT ST | 4 | | HALL ST | 4 | | LARRY FINCH ROAD | 4 | | MAIN | 4 | | MORELLA RD | 4 | | MORILLA ROAD | 4 | | POPLAR ST | 4 |
| | | Fire incidents reported |
|---|
| Sreet name | Count |
|---|
| PREACHER DOWLAND RD | 4 | | RUTHERFORD HWY HWY | 4 | | SANDERSON ST | 4 | | SILER ROAD | 4 | | STRINGTOWN RD RD | 4 | | TOOLE PATE LEEVE ROAD | 4 | | TOOLE PATE LEVEE RD | 4 | | TYSON STORE ROAD | 4 | | TYSON STORE-MASON HALL RD | 4 | | TYSON-MASON HALL RD | 4 | | UNION GROVE RD | 4 | | UNION GROVE RD RD | 4 | | UNION GROVE ROAD | 4 | | 1 BARNER RD. | 2 | | 1 BARNER ROAD | 2 | | 10159 HWY 89 | 2 | | 110 MORELLA RD | 2 | | 115 NEELY THOMAS RD. | 2 | | 405 PEARL DR. | 2 | | 45 STRINGTOWN RD | 2 | | 45 W | 2 | | 4810 PERSIMMON HEIGHTS ROAD | 2 | | 769 MORELLA RD | 2 | | 89 | 2 | | |
|
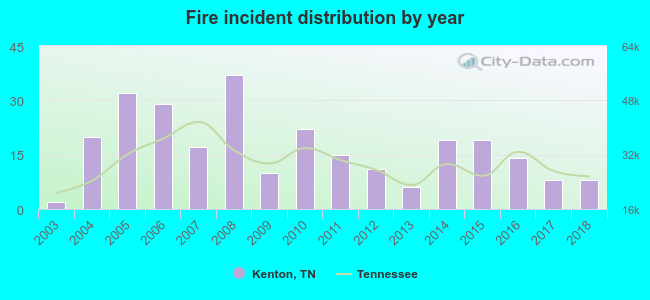 According to the data from the years 2003 - 2018 the average number of fires per year is 17. The highest number of reported fires - 37 took place in 2008, and the least - 2 in 2003. The data has a rising trend.
 25.7% incidents where reported in the morning and 74.3% in the evening. The most fires (16.7%) took place on Wednesday, and the least (11.5%) on Saturday.
 According to the 269 incident reports from years 2003 - 2018 most fires (14.5%) took place during August, and the least (3.3%) in April.
 Out of all 783 cases reported during the years 2003 - 2018, the most belonged to the categories: Rescue & EMS (52.6%), Fire (34.4%), and Hazardous Condition (4.6%).
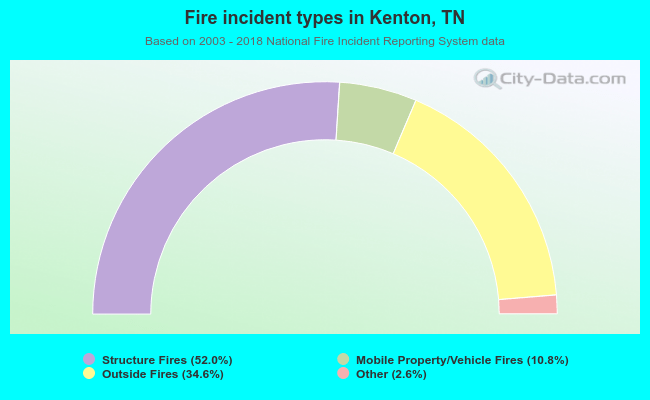 When looking into fire subcategories, the most reports belonged to: Structure Fires (52.0%), and Outside Fires (34.6%).