Kettle Falls: Fire Incidents, Washington (WA)
Where are fire incidents reported in Kettle Falls, WA
Something went wrong! Please refresh the page.
|
| |||||||||||||||||||||||||||||||||||||||||||||||||||||||||||||||||||||||||||||||||||||||||||||||||||||||||||||
| Other | 221 | |||||||||||||||||||||||||||||||||||||||||||||||||||||||||||||||||||||||||||||||||||||||||||||||||||||||||||||
2003 - 2018 National Fire Incident Reporting System (NFIRS) incidents
- Incident types reported to NFIRS in Kettle Falls, WA
- 53353.7%Fire
- 14814.9%Rescue & EMS
- 12913.0%Hazardous Condition
- 636.4%Good Intent Call
- 545.4%Service Call
- 535.3%False Alarm
- 80.8%Special Incident
- 30.3%Severe Weather
- 10.1%Overpressure Rupture
- Fire incident types reported to NFIRS in Kettle Falls, WA
- 29655.5%Outside Fires
- 15228.5%Structure Fires
- 438.1%Other
- 427.9%Mobile Property/Vehicle Fires
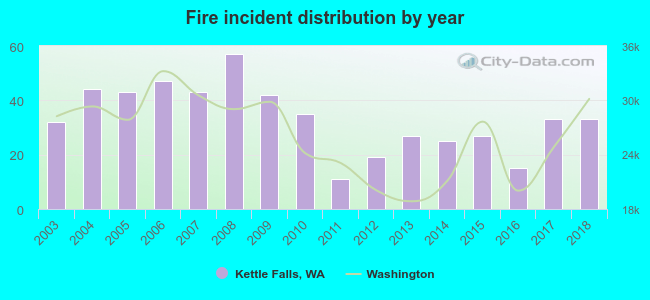 According to the data from the years 2003 - 2018 the average number of fires per year is 33. The highest number of reported fires - 57 took place in 2008, and the least - 11 in 2011. The data has a rising trend.
 The median response time based on all reported fire incidents is 5 minutes. This is lower compared to the state median value.
The median response time in Kettle Falls, WA compared to nearest cities:
(Note: Based on data for all years, including only cities with at least 500 fire incidents)
| Kettle Falls: | 5 minutes |
| Colville: | 5 minutes |
| Chewelah: | 7 minutes |
| Deer Park: | 10 minutes |
| Newport: | 13 minutes |
| Priest River: | 9 minutes |
| Omak: | 5 minutes |
| Airway Heights: | 6 minutes |
| Spokane: | 6 minutes |
 29.6% incidents where reported in the morning and 70.4% in the evening. The most fires (17.3%) took place on Wednesday, and the least (9.9%) on Sunday.
 Based on the 533 fires from years 2003 - 2018 most fires (17.4%) took place during July, and the least (4.5%) in December.
 Out of all 992 cases reported during the years 2003 - 2018, the most belonged to the categories: Fire (53.7%), Rescue & EMS (14.9%), and Hazardous Condition (13.0%).
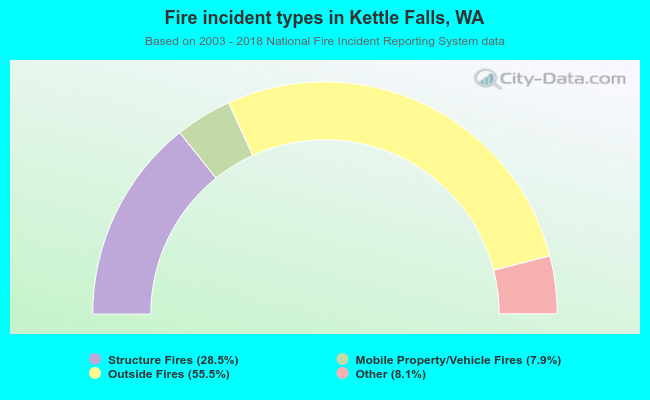 When looking into fire subcategories, the most incidents belonged to: Outside Fires (55.5%), and Structure Fires (28.5%).