Kewanna: Fire Incidents, Indiana (IN)
Where are fire incidents reported in Kewanna, IN
Something went wrong! Please refresh the page.
|
| |||||||||||||||||||||||||||||||||||||||||||||||||||||||||||||||||||||||||||||||||||||||||||||||||||||||||||||
| Other | 12 | |||||||||||||||||||||||||||||||||||||||||||||||||||||||||||||||||||||||||||||||||||||||||||||||||||||||||||||
2002 - 2017 National Fire Incident Reporting System (NFIRS) incidents
- Incident types reported to NFIRS in Kewanna, IN
- 17242.8%Fire
- 9022.4%Good Intent Call
- 8521.1%Rescue & EMS
- 276.7%Hazardous Condition
- 153.7%Service Call
- 92.2%Special Incident
- 20.5%False Alarm
- 10.2%Overpressure Rupture
- 10.2%Severe Weather
- Fire incident types reported to NFIRS in Kewanna, IN
- 7744.8%Structure Fires
- 6537.8%Outside Fires
- 1911.0%Other
- 116.4%Mobile Property/Vehicle Fires
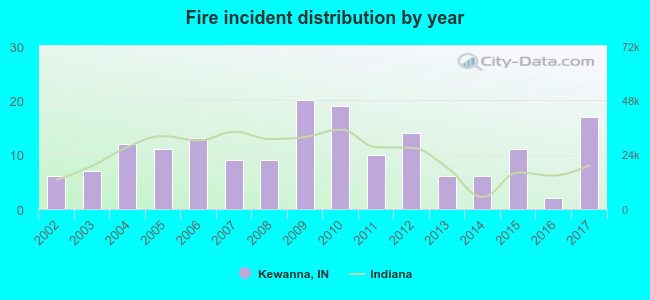 Based on the data from the years 2002 - 2017 the average number of fire incidents per year is 11. The highest number of reported fires - 20 took place in 2009, and the least - 2 in 2016. The data has a growing trend.
 27.9% incidents where reported in the morning and 72.1% in the evening. The most fires (18.6%) took place on Monday, and the least (9.3%) on Tuesday.
 Based on the 172 fire incidents from years 2002 - 2017 most fires (19.2%) took place during March, and the least (4.7%) in January.
 Out of all 402 cases reported during the years 2002 - 2017, the most belonged to the categories: Fire (42.8%), Good Intent Call (22.4%), and Rescue & EMS (21.1%).
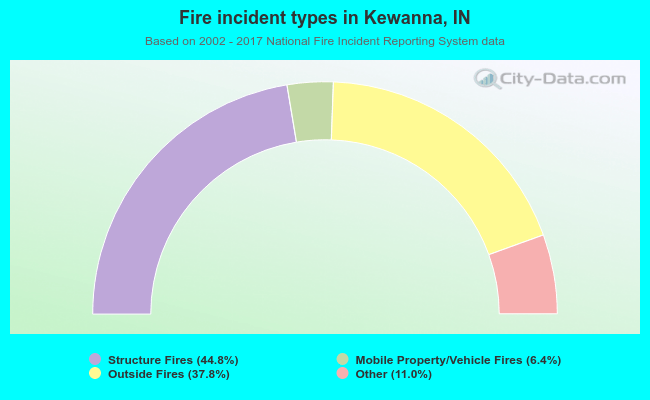 When looking into fire subcategories, the most reports belonged to: Structure Fires (44.8%), and Outside Fires (37.8%).