| Fire incidents reported |
|---|
| Sreet name | Count |
|---|
| KUHIO HWY | 28 | | KILAUEA RD | 24 | | WAIAKALUA RD | 14 | | KOLO RD | 12 | | WAIAKALUA ST | 12 | | WAILAPA RD | 12 | | KENEKE ST | 10 | | ROCK QUARRY RD | 8 | | HOOKUI RD | 6 | | KALIHIWAI RD | 6 | | KAUAPEA RD | 6 | | KUAWA RD | 6 | | AALONA PL | 4 | | AALONA ST | 4 | | KAHILI MAKAI ST | 4 | | KAPUNA RD | 4 | | KOOLAU RD | 4 | | ULUA ST | 4 | | BCH | 2 | | RD | 2 | | 2840 KAUPEA RD | 2 | | ACCESS TO SECRET BEA | 2 | | ALA MUKU | 2 | | BACK OF KILAUEA | 2 | | BEHIND KILAUEA POST OFFICE | 2 |
| | | Fire incidents reported |
|---|
| Sreet name | Count |
|---|
| HO' OKUI ST | 2 | | HULI RD | 2 | | IHOPE PL | 2 | | IOELA ST | 2 | | KAHILI BEACH BCH | 2 | | KAHILI MAKAI | 2 | | KAHILI QUARRY RD | 2 | | KAHILIHOLO RD | 2 | | KAHILIHOLO ST | 2 | | KALAMANIA PL | 2 | | KALIHIWAI VALLEY RD | 2 | | KANIKELE RD | 2 | | KAPUNA ST | 2 | | KAUPEA RD | 2 | | KUHIO HWY VIC MM21 | 2 | | LARSENS | 2 | | LARSENS BEACH | 2 | | LARSENS BEACH PLOT | 2 | | MALULANI ST | 2 | | MOMI ST | 2 | | OPEN FIELD NEAR THE POST OFFIC | 2 | | PILA | 2 | | PILI RD | 2 | | SEA CLIFFS KILA | 2 | | |
|
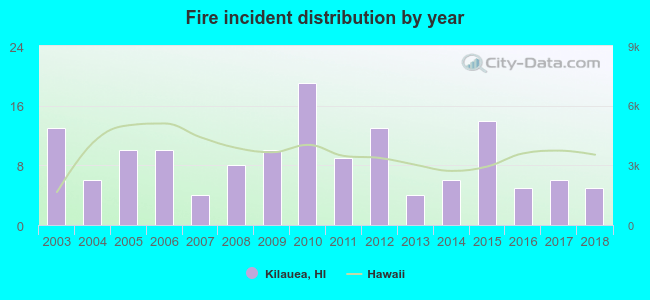 According to the data from the years 2003 - 2018 the average number of fires per year is 9. The highest number of reported fires - 19 took place in 2010, and the least - 4 in 2007. The data has a dropping trend.
 31.0% incidents where reported in the morning and 69.0% in the evening. The most fires (16.9%) took place on Thursday, and the least (12.0%) on Monday.
 Based on the 142 fire incident reports from years 2003 - 2018 most fires (11.3%) took place during January, and the least (5.6%) in October.
 Out of all 1,042 cases reported during the years 2003 - 2018, the most belonged to the categories: Overpressure Rupture (39.6%), Service Call (37.5%), and Fire (13.6%).
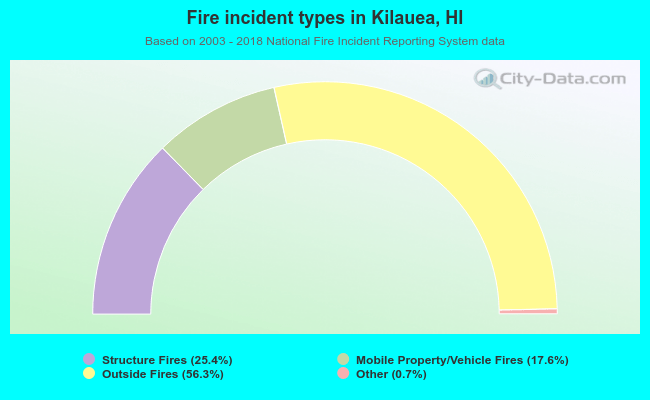 When looking into fire subcategories, the most reports belonged to: Outside Fires (56.3%), and Structure Fires (25.4%).