Kill Devil Hills: Fire Incidents, North Carolina (NC)
Where are fire incidents reported in Kill Devil Hills, NC
Something went wrong! Please refresh the page.
| Fire incidents reported | |
|---|---|
| Sreet name | Count |
| CROATAN HWY | 334 |
| VIRGINIA DARE TRL | 312 |
| COLINGTON RD | 104 |
| VIRGINA DARE TRL | 66 |
| VA DARE TRL | 56 |
| HARBOUR VIEW DR | 42 |
| VETERANS DR | 36 |
| THIRD ST | 32 |
| OCEAN BAY BLVD | 30 |
| AIRSTRIP RD | 26 |
| BAY DR | 24 |
| PALMETTO ST | 22 |
| AVALON DR | 20 |
| COLINGTON DR | 20 |
| FIRST FLIGHT LN | 20 |
| MEMORIAL BLVD | 20 |
| OCEAN ACRES DR | 20 |
| FIFTH ST | 18 |
| QUAIL LN | 18 |
| SIR CHANDLER DR | 18 |
| CHOWAN ST | 16 |
| SEMINOLE ST | 16 |
| SIR RICHARD | 16 |
| SWAN ST | 16 |
| ATLANTIC ST | 14 |
| CANAL DR | 14 |
| LANDING DR | 14 |
| RAYMOND AVE | 14 |
| CEDAR DR | 12 |
| FIRST ST | 12 |
2002 - 2018 National Fire Incident Reporting System (NFIRS) incidents
- Incident types reported to NFIRS in Kill Devil Hills, NC
- 8,08244.8%Rescue & EMS
- 3,85321.3%Hazardous Condition
- 2,64514.7%Service Call
- 1,2496.9%Good Intent Call
- 1,1786.5%Fire
- 9005.0%False Alarm
- 810.4%Special Incident
- 470.3%Severe Weather
- Fire incident types reported to NFIRS in Kill Devil Hills, NC
- 60050.9%Structure Fires
- 40734.6%Outside Fires
- 12610.7%Mobile Property/Vehicle Fires
- 453.8%Other
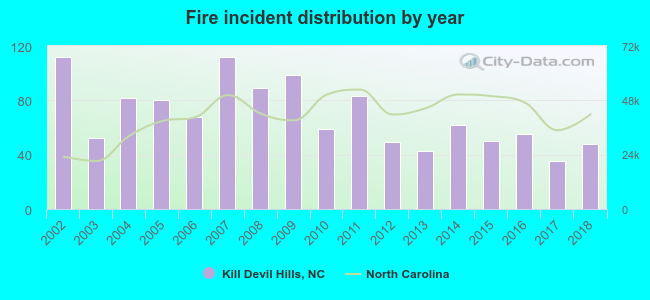 Based on the data from the years 2002 - 2018 the average number of fires per year is 69. The highest number of reported fire incidents - 112 took place in 2002, and the least - 35 in 2017. The data has a decreasing trend.
The average number of yearly fire incidents per 10k residents in Kill Devil Hills, NC compared to nearest cities:
(Note: Based on data for the last 3 years, including only cities with population 5,000 and above)
| Kill Devil Hills: | 66.4 |
| Elizabeth City: | 58.9 |
| Williamston: | 114.0 |
| Washington: | 112.4 |
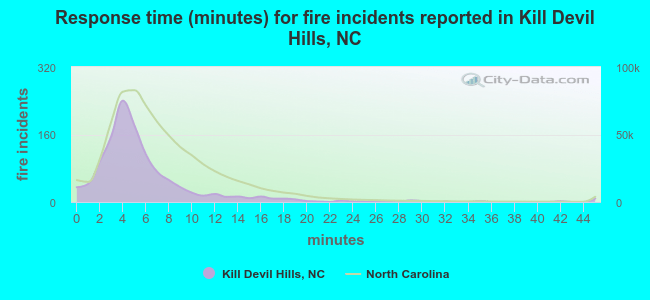 The median response time based on all reported fire incidents is 5 minutes. This is lower than the state median value.
The median response time in Kill Devil Hills, NC compared to nearest cities:
(Note: Based on data for all years, including only cities with at least 500 fire incidents)
| Kill Devil Hills: | 5 minutes |
| Kitty Hawk: | 6 minutes |
| Nags Head: | 6 minutes |
| Elizabeth City: | 5 minutes |
| Hertford: | 11 minutes |
| Edenton: | 6 minutes |
| Plymouth: | 7 minutes |
| Ahoskie: | 6 minutes |
| Williamston: | 5 minutes |
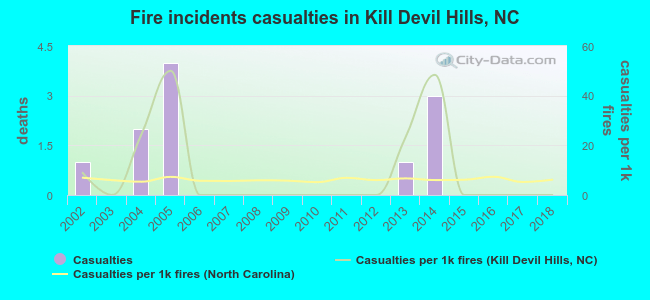 According to the reports from the years 2002 - 2018 the average number of fire-related casualties per year is 1. The highest number of casualties - 4 took place in 2005, and the lowest - 0 in 2003. The data has a decreasing trend.
The average number of injuries per 1,000 fires is 9. This indicator was the highest - 50 in 2005, and the lowest 0 in 2003. The trend for injuries per 1,000 fire incidents is decreasing. Compared to the North Carolina value the number of injuries per 1,000 incidents is higher.
According to the reports from the years 2002 - 2018 the average number of fire-related casualties per year is 1. The highest number of casualties - 4 took place in 2005, and the lowest - 0 in 2003. The data has a decreasing trend.
The average number of injuries per 1,000 fires is 9. This indicator was the highest - 50 in 2005, and the lowest 0 in 2003. The trend for injuries per 1,000 fire incidents is decreasing. Compared to the North Carolina value the number of injuries per 1,000 incidents is higher.Casualties per 1,000 incidents in Kill Devil Hills, NC compared to nearest cities:
(Note: Based on data for all years, including only cities with at least 500 fire incidents)
| Kill Devil Hills: | 9.3 |
| Kitty Hawk: | 0.0 |
| Nags Head: | 8.5 |
| Elizabeth City: | 7.3 |
| Hertford: | 1.2 |
| Edenton: | 4.4 |
| Plymouth: | 0.0 |
| Ahoskie: | 15.9 |
| Williamston: | 13.8 |
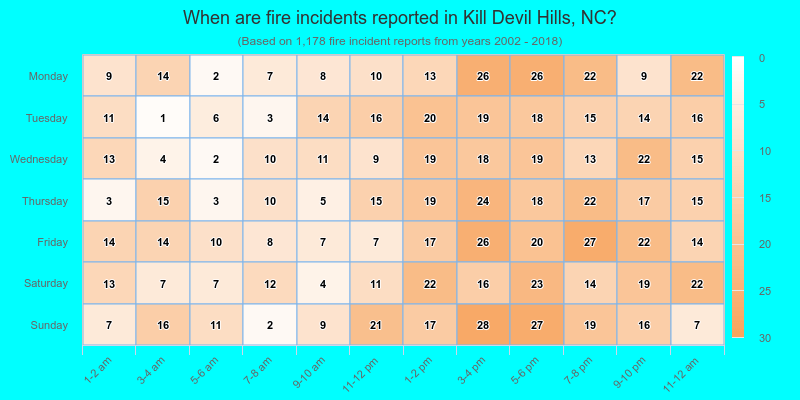
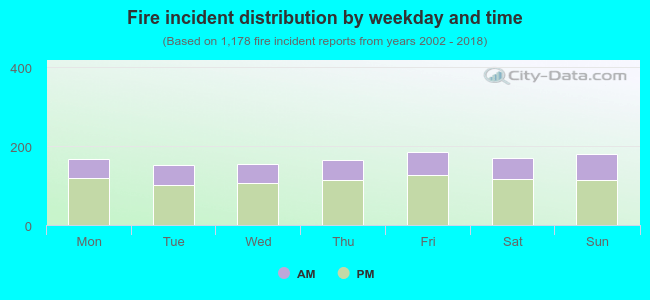 32.3% incidents where reported in the morning and 67.7% in the evening. The most fires (15.8%) took place on Friday, and the least (13.0%) on Tuesday.
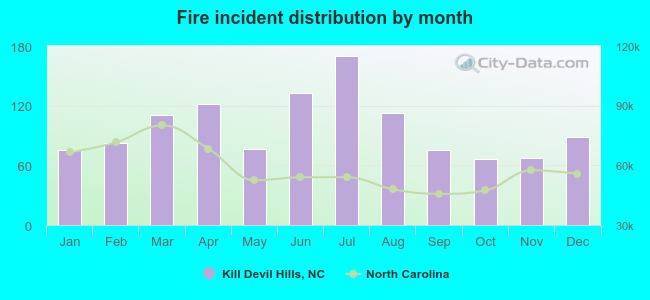 Based on the 1,178 fires from years 2002 - 2018 most fires (14.4%) took place during July, and the least (5.6%) in October.
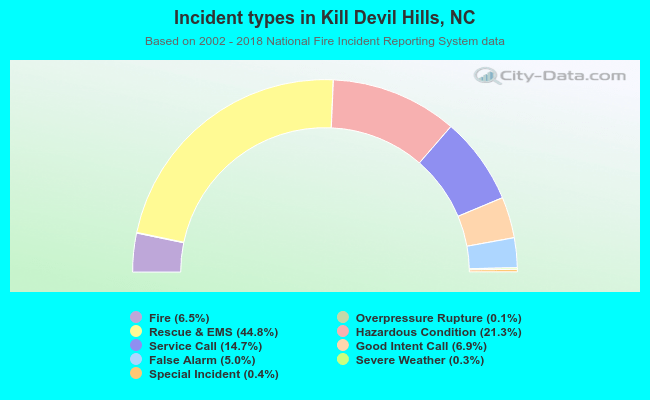 Out of all 18,049 cases reported during the years 2002 - 2018, the most belonged to the categories: Rescue & EMS (44.8%), Hazardous Condition (21.3%), and Service Call (14.7%).
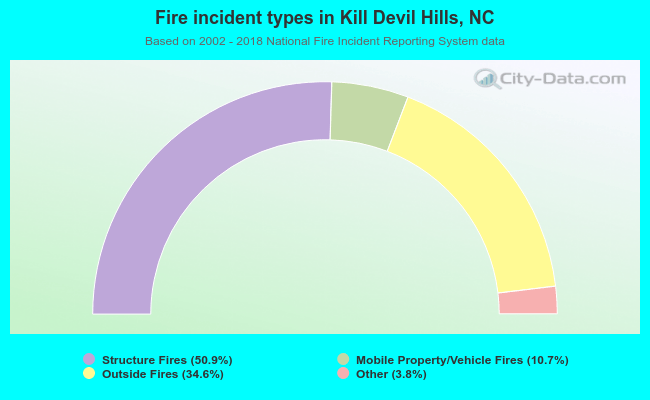 When looking into fire subcategories, the most reports belonged to: Structure Fires (50.9%), and Outside Fires (34.6%).