Killbuck: Fire Incidents, Ohio (OH)
Where are fire incidents reported in Killbuck, OH
Something went wrong! Please refresh the page.
|
| |||||||||||||||||||||||||||||||||||||||||||||||||||||||||||||||||||||||||||||||||||||||||||||||||||||||||||||
2002 - 2018 National Fire Incident Reporting System (NFIRS) incidents
- Incident types reported to NFIRS in Killbuck, OH
- 28931.6%Fire
- 25427.7%Rescue & EMS
- 15817.2%Hazardous Condition
- 11412.4%Service Call
- 556.0%Good Intent Call
- 343.7%False Alarm
- 80.9%Special Incident
- 30.3%Severe Weather
- 10.1%Overpressure Rupture
- Fire incident types reported to NFIRS in Killbuck, OH
- 15252.6%Structure Fires
- 9833.9%Outside Fires
- 3612.5%Mobile Property/Vehicle Fires
- 31.0%Other
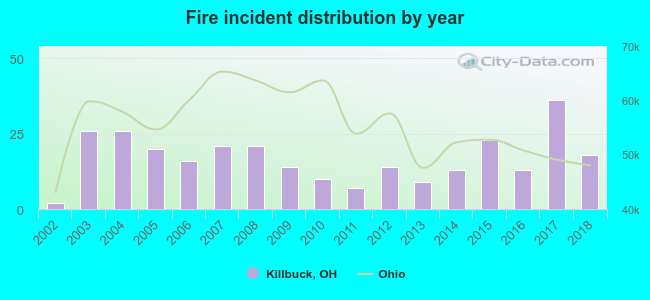 According to the data from the years 2002 - 2018 the average number of fires per year is 17. The highest number of reported fires - 36 took place in 2017, and the least - 2 in 2002. The data has an increasing trend.
 Based on the data from the years 2002 - 2018 the average number of fire-related fatalities per year is 0. The highest number of reported deaths - 1 took place in 2012, and the lowest - 0 in 2002. The data has a constant trend.
 28.4% incidents where reported in the morning and 71.6% in the evening. The most fires (21.5%) took place on Friday, and the least (10.7%) on Sunday.
 According to the 289 incident reports from years 2002 - 2018 most fires (14.9%) took place during February, and the least (2.4%) in September.
 Out of all 916 cases reported during the years 2002 - 2018, the most belonged to the categories: Fire (31.6%), Rescue & EMS (27.7%), and Hazardous Condition (17.2%).
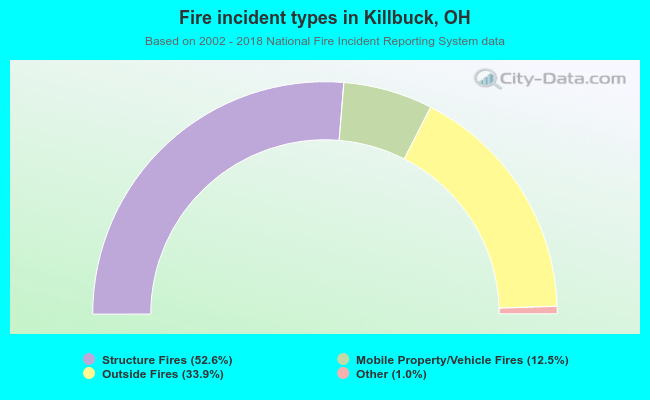 When looking into fire subcategories, the most incidents belonged to: Structure Fires (52.6%), and Outside Fires (33.9%).