| Fire incidents reported |
|---|
| Sreet name | Count |
|---|
| HWY 22 NORTH | 22 | | HWY 200 WEST | 18 | | BI HUTCH TRAILER COURT | 6 | | GAP ROAD | 6 | | HWY 200 | 6 | | HWY 22 | 6 | | HWY 22 SOUTH | 6 | | 11089 HWY 200 | 4 | | 1ST ST SW KILLDEER | 4 | | 206 HWY 22 NORTH | 4 | | 2ND ST NW 106AVE NW | 4 | | 335 CENTRAL AVE | 4 | | 511 110 AVE SW | 4 | | 849 114TH AVE NW | 4 | | HWY 200 EAST | 4 | | LONE BUTTE ROAD | 4 | | RODEO DRIVE | 4 | | BORDER STATION ROAD | 2 | | 1 WEST ON 15TH ST SW | 2 | | 1001 111AVE SW | 2 | | 101 AVE | 2 | | 101 FIRST ST | 2 | | 10271 15 ST SW | 2 | | 10271 15TH ST SW | 2 | | 10275 3RD AVE SW | 2 |
| | | Fire incidents reported |
|---|
| Sreet name | Count |
|---|
| 103 AVE 2ND ST | 2 | | 103RD AVE | 2 | | 103RD AVE SE | 2 | | 10456 10TH ST NW | 2 | | 104TH AVE | 2 | | 104TH AVE | 2 | | 104TH AVE HIGHWAY 22 NORTH | 2 | | 105 AVE | 2 | | 10540 SPRING CREEK ROAD | 2 | | 10540TH 1ST SW | 2 | | 10591 7 ST SW | 2 | | 106 AVE SE | 2 | | 106TH AVE SW | 2 | | 107 AVE | 2 | | 10730 HIGHWAY 22 NORTH | 2 | | 1080 101 AVE SW | 2 | | 109 7THSST SW | 2 | | 10929 4TH ST NW | 2 | | 10959 7 ST SW | 2 | | 109TH AVE | 2 | | 109TH AVE NW | 2 | | 110 1ST ST NE | 2 | | 111 AVE | 2 | | 112 AVE NW AND 12 ST SW | 2 | | |
|
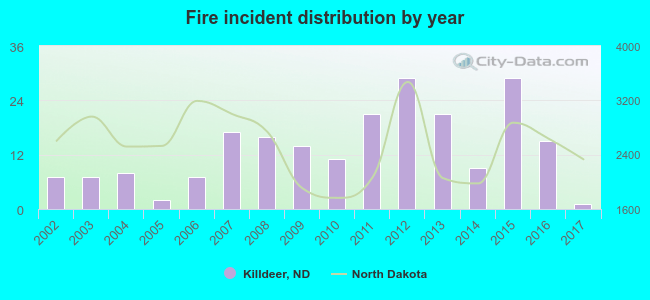 Based on the data from the years 2002 - 2017 the average number of fire incidents per year is 13. The highest number of reported fire incidents - 29 took place in 2012, and the least - 1 in 2017. The data has a dropping trend.
 35.0% incidents where reported in the morning and 65.0% in the evening. The most fires (20.1%) took place on Saturday, and the least (7.0%) on Sunday.
 According to the 214 fire incident reports from years 2002 - 2017 most fires (17.3%) took place during August, and the least (3.7%) in January.
 Out of all 303 cases reported during the years 2002 - 2017, the most belonged to the categories: Fire (70.6%), Service Call (13.5%), and Rescue & EMS (5.9%).
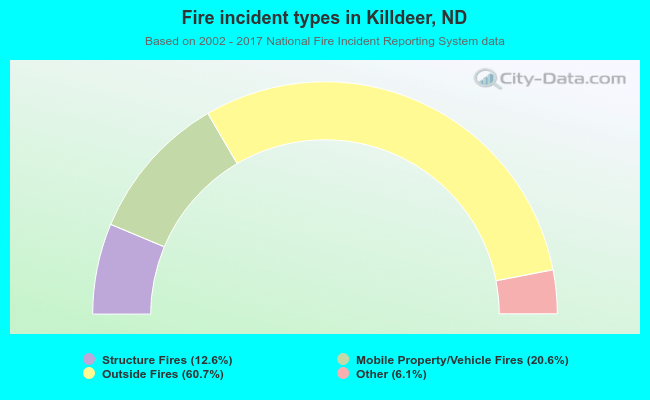 When looking into fire subcategories, the most incidents belonged to: Outside Fires (60.7%), and Mobile Property/Vehicle Fires (20.6%).