| Fire incidents reported |
|---|
| Sreet name | Count |
|---|
| EAST MOUNTAIN RD | 40 | | KILLINGTON RD | 22 | | ALPINE DR | 20 | | US ROUTE 4 HWY | 20 | | MERRILL DR | 6 | | OLD MILL ROAD PVT | 6 | | ROARING BROOK RD | 6 | | TIMBERLINE DRIVE EXT | 6 | | 2402 KILLINGTON RD | 4 | | 50 CLIFF RD | 4 | | ANTHONY WAY | 4 | | EAST MOUNTAIN ROAD | 4 | | HIGHRIDGE ROAD PVT | 4 | | INNSBRUCK LANE | 4 | | INNSBRUCK LN | 4 | | KILLINGTON ACCESS RD | 4 | | KILLINGTON ACCESS ROAD | 4 | | RIVER RD | 4 | | ROARING BROOK RD | 4 | | ROUTE 4 | 4 | | SCHOOLHOUSE RD | 4 | | SPRING HILL RD | 4 | | TANGLEWOOD DR | 4 | | WEST HILL RD | 4 | | WEST PARK RD | 4 |
| | | Fire incidents reported |
|---|
| Sreet name | Count |
|---|
| WEST PARK ROAD | 4 | | WOODS LANE PVT | 4 | | 115 COFFEE HOUSE RD | 2 | | 125 HEMLOCK RIDGE RD | 2 | | 204 TERRACE LANE | 2 | | 2046 ROUTE 4 | 2 | | 21 WINDING WAY | 2 | | 2417 EAST MOUNTAIN RD | 2 | | 252 UNIT D2 TELEMARK VILLAGE | 2 | | 275 STAGE ROAD | 2 | | 2841 KILLINGTON RD | 2 | | 3112 ROUTE 100N | 2 | | 325 BRAD MEAD DRIVE | 2 | | 3605 TERRACE DRIVE | 2 | | 388 KILLINGTON RD | 2 | | 416 KILLINGTON RD | 2 | | 42 PRIOR DRIVE | 2 | | 4489 ROUTE 4 | 2 | | 474 WEST HILL RD | 2 | | 476 BARROWSTOWNE RD | 2 | | 4763 KILLINGTON RD | 2 | | 4900 US ROUTE 4 | 2 | | 59 ALPINE DR | 2 | | 64 ALPINE TERRACE | 2 | | |
|
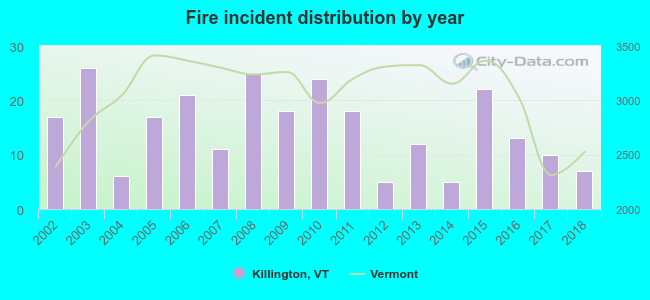 According to the data from the years 2002 - 2018 the average number of fires per year is 15. The highest number of reported fires - 26 took place in 2003, and the least - 5 in 2012. The data has a decreasing trend.
 33.1% incidents where reported in the morning and 66.9% in the evening. The most fires (17.1%) took place on Saturday, and the least (10.1%) on Tuesday.
 Based on the 257 fire incidents from years 2002 - 2018 most fires (23.0%) took place during January, and the least (2.3%) in July.
 Out of all 1,873 cases reported during the years 2002 - 2018, the most belonged to the categories: Rescue & EMS (42.8%), False Alarm (22.7%), and Fire (13.7%).
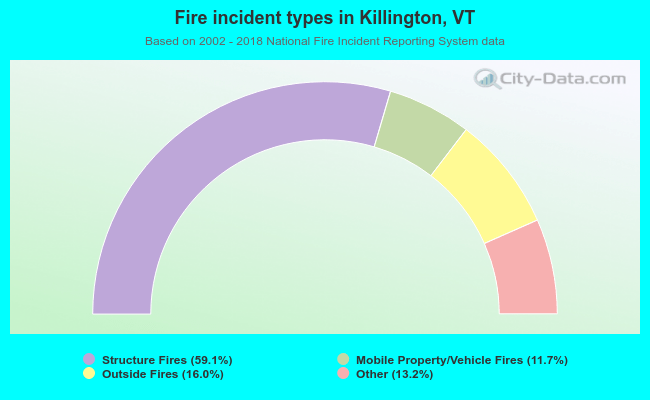 When looking into fire subcategories, the most incidents belonged to: Structure Fires (59.1%), and Outside Fires (16.0%).