| Fire incidents reported |
|---|
| Sreet name | Count |
|---|
| FM 1150 | 22 | | FM 1104 | 18 | | FM 1339 | 16 | | IH 10 E | 16 | | ALTERNATE 90 | 14 | | GANDER SLOUGH RD | 12 | | HWY 90 | 12 | | IH 10 | 12 | | JONES RD | 12 | | GANDER SLOUGH | 8 | | KINGSBURY RD | 8 | | APPLING RD | 6 | | CAMPOBELLA LN | 6 | | IH10 | 6 | | US HWY 90 | 6 | | WOODROW CENTER RD | 6 | | 90 HWY | 4 | | CAMPOBELLA LN | 4 | | COLLINS LN | 4 | | DOWDY RD | 4 | | FM 20 | 4 | | FM 2438 | 4 | | FM 3353 | 4 | | GANDER SLOUGH RD | 4 | | I10 | 4 |
| | | Fire incidents reported |
|---|
| Sreet name | Count |
|---|
| IH-10 | 4 | | INDIAN SPRINGS DR | 4 | | KELLY RD | 4 | | KINGSBURY RD | 4 | | MILL CREEK RD | 4 | | OLD LEHMAN RD | 4 | | POST OFFICE RD | 4 | | SAVAGE RANCH RD | 4 | | WILKE RD | 4 | | WOODROW CENTER | 4 | | WOODROW CENTER RD | 4 | | 100 BLK LONELY RD | 2 | | 1100 BLOCK OF WEST AVE | 2 | | 1104 | 2 | | 3500 BLK SH130 | 2 | | 5500 BLOCK OF FM 1104 | 2 | | 610 MILE MARKER I10 HWY | 2 | | 7 MILES WEST OF LULING ON US 9 | 2 | | BLK WEST AVE | 2 | | BLOCK IH 10 HWY | 2 | | BLOCK KINGSBURY RD. | 2 | | BLOCK OF CROSS RD. | 2 | | BLOCK OF NASH CREEK | 2 | | BLOCK OF RED ROCK LANE | 2 | | BLOCK OF US HWY 90 | 2 |
|
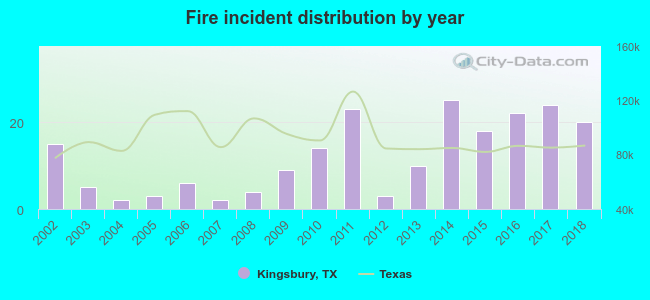 According to the data from the years 2002 - 2018 the average number of fires per year is 12. The highest number of reported fires - 25 took place in 2014, and the least - 2 in 2004. The data has an increasing trend.
 22.9% incidents where reported in the morning and 77.1% in the evening. The most fires (20.5%) took place on Saturday, and the least (9.3%) on Sunday.
 Based on the 205 reports from years 2002 - 2018 most fires (13.7%) took place during January, and the least (3.9%) in May.
 Out of all 634 cases reported during the years 2002 - 2018, the most belonged to the categories: Overpressure Rupture (49.2%), Fire (32.3%), and Service Call (11.4%).
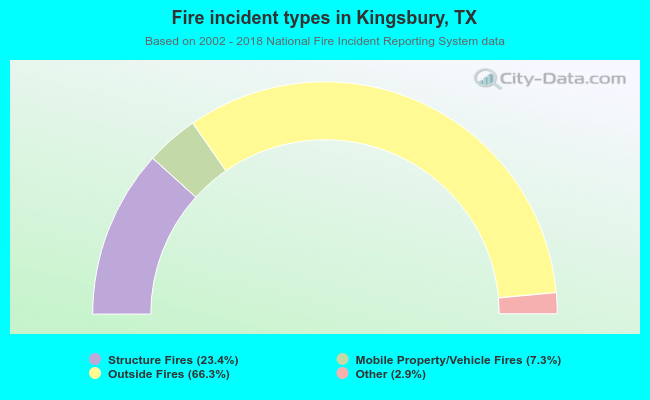 When looking into fire subcategories, the most incidents belonged to: Outside Fires (66.3%), and Structure Fires (23.4%).