Kirbyville: Fire Incidents, Missouri (MO)
Where are fire incidents reported in Kirbyville, MO
Something went wrong! Please refresh the page.
|
| |||||||||||||||||||||||||||||||||||||||||||||||||||||||||||||||||||||||||||||||||||||||||||||||||||||||||||||
2008 - 2018 National Fire Incident Reporting System (NFIRS) incidents
- Incident types reported to NFIRS in Kirbyville, MO
- 28739.8%Fire
- 27438.0%Rescue & EMS
- 11115.4%Good Intent Call
- 212.9%Hazardous Condition
- 202.8%Service Call
- 60.8%False Alarm
- 10.1%Severe Weather
- 10.1%Special Incident
- Fire incident types reported to NFIRS in Kirbyville, MO
- 16356.8%Outside Fires
- 8931.0%Structure Fires
- 289.8%Mobile Property/Vehicle Fires
- 72.4%Other
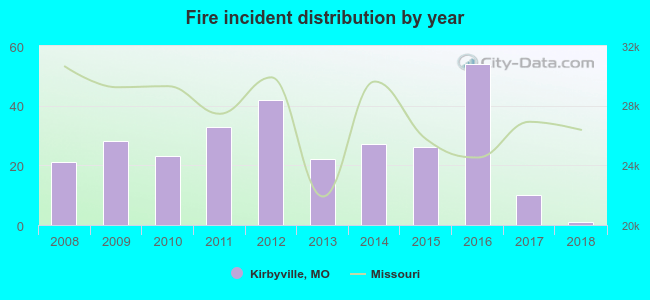 According to the data from the years 2008 - 2018 the average number of fire incidents per year is 26. The highest number of reported fire incidents - 54 took place in 2016, and the least - 1 in 2018. The data has a dropping trend.
 23.0% incidents where reported in the morning and 77.0% in the evening. The most fires (16.4%) took place on Monday, and the least (8.7%) on Thursday.
 Based on the 287 reports from years 2008 - 2018 most fires (13.9%) took place during January, and the least (4.2%) in May.
 Out of all 721 cases reported during the years 2008 - 2018, the most belonged to the categories: Fire (39.8%), Overpressure Rupture (38.0%), and Service Call (15.4%).
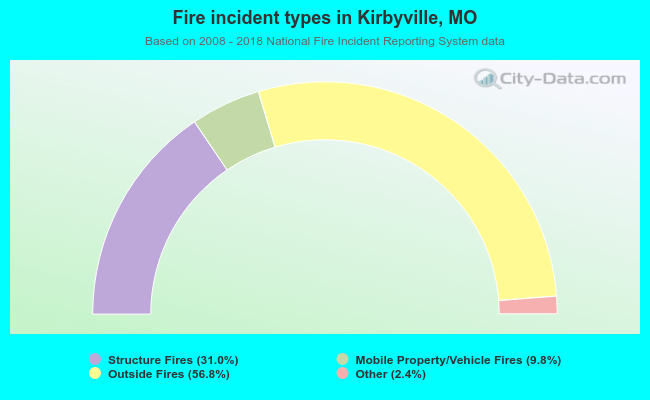 When looking into fire subcategories, the most reports belonged to: Outside Fires (56.8%), and Structure Fires (31.0%).