| Fire incidents reported |
|---|
| Sreet name | Count |
|---|
| KIRKWOOD PIKE | 38 | | STREET RD | 18 | | KIRKWOOD PIKE | 14 | | LONG LN | 10 | | KIRKWOOD (ROUTE 472) PIKE | 8 | | STREET RD | 8 | | FREDERICK WAY | 6 | | LAKEVIEW RD | 6 | | LIBERTY LN | 6 | | LIBERTY LN | 6 | | MAPLE SHADE RD | 6 | | MORRISON MILL RD | 6 | | NOBLE RD | 6 | | PUMPING STATION RD | 6 | | RIDGE RD | 6 | | ACADEMY RD | 4 | | ACADEMY RD | 4 | | BRIDLE PATH | 4 | | BUTTERMILK LN | 4 | | COOPERS DR | 4 | | LONG LN | 4 | | MORRISON MILL RD | 4 | | NOBLE RD | 4 | | RT 472 | 4 | | SALEM RD | 4 |
| | | Fire incidents reported |
|---|
| Sreet name | Count |
|---|
| SPROUL RD | 4 | | WESLEY RD | 4 | | 1323 RT 11 TRIM ST VERNON ST | 2 | | 1375 SR 11 HWY | 2 | | 1598 ROUTE 11 ST | 2 | | BARTVILLE RD | 2 | | BARTVILLE ROAD | 2 | | BELL RD | 2 | | BELL ROAD | 2 | | CHARLES WAY | 2 | | COOPER DR | 2 | | FAIRMOUNT RD | 2 | | FARMDALE RD | 2 | | FREDRICK WAY | 2 | | HILL RD | 2 | | I81 NORTH HWY | 2 | | KIRKWOOD PK | 2 | | KIRKWOODROUTE 472 PIKE | 2 | | LAURA CT | 2 | | LONG LANE | 2 | | MAPLE SHADE RD | 2 | | MOUNT EDEN RD | 2 | | MT EDEN | 2 | | MT EDEN RD | 2 | | |
|
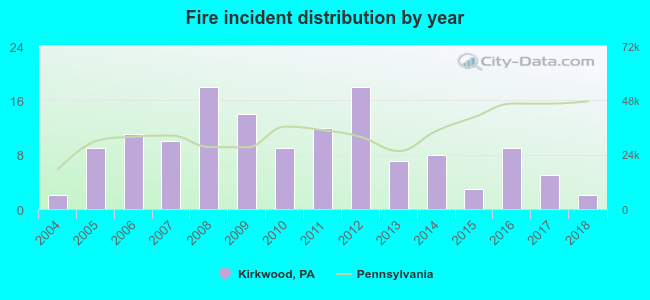 According to the data from the years 2004 - 2018 the average number of fires per year is 9. The highest number of fires - 18 took place in 2008, and the least - 2 in 2004. The data has a constant trend.
 28.5% incidents where reported in the morning and 71.5% in the evening. The most fires (16.8%) took place on Tuesday, and the least (10.9%) on Sunday.
 Based on the 137 reports from years 2004 - 2018 most fires (13.9%) took place during April, and the least (2.2%) in July.
 Out of all 243 cases reported during the years 2004 - 2018, the most belonged to the categories: Fire (56.4%), Rescue & EMS (20.6%), and Overpressure Rupture (12.8%).
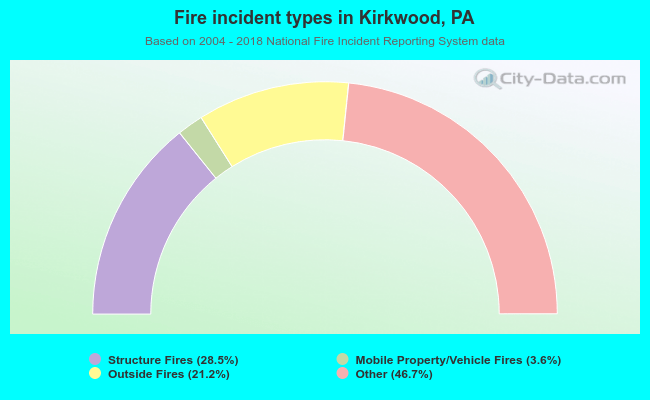 When looking into fire subcategories, the most reports belonged to: Other (46.7%), and Structure Fires (28.5%).