Kismet: Fire Incidents, Kansas (KS)
Where are fire incidents reported in Kismet, KS
Something went wrong! Please refresh the page.
|
| |||||||||||||||||||||||||||||||||||||||||||||||||||||||||||||||||||||||||||||||||||||
| Other | 13 | |||||||||||||||||||||||||||||||||||||||||||||||||||||||||||||||||||||||||||||||||||||
2002 - 2018 National Fire Incident Reporting System (NFIRS) incidents
- Incident types reported to NFIRS in Kismet, KS
- 15339.7%Fire
- 10527.3%Rescue & EMS
- 7319.0%Good Intent Call
- 266.8%Service Call
- 225.7%Hazardous Condition
- 41.0%False Alarm
- 20.5%Special Incident
- Fire incident types reported to NFIRS in Kismet, KS
- 10468.0%Outside Fires
- 2214.4%Mobile Property/Vehicle Fires
- 2013.1%Structure Fires
- 74.6%Other
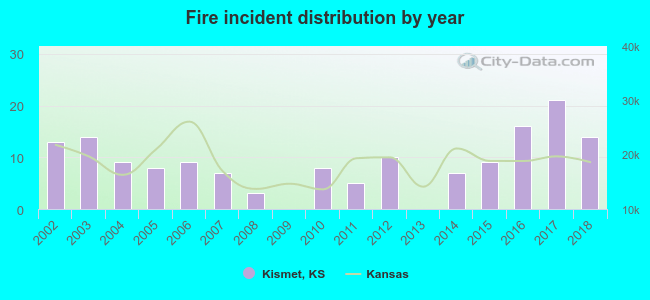 Based on the data from the years 2002 - 2018 the average number of fires per year is 9. The highest number of reported fires - 21 took place in 2017, and the least - 0 in 2009. The data has a growing trend.
 22.2% incidents where reported in the morning and 77.8% in the evening. The most fires (19.0%) took place on Friday, and the least (9.2%) on Sunday.
 According to the 153 reports from years 2002 - 2018 most fires (20.3%) took place during June, and the least (2.0%) in December.
 Out of all 385 cases reported during the years 2002 - 2018, the most belonged to the categories: Fire (39.7%), Overpressure Rupture (27.3%), and Service Call (19.0%).
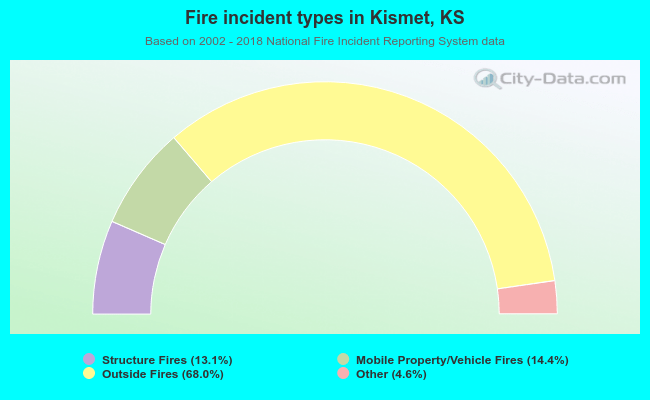 When looking into fire subcategories, the most incidents belonged to: Outside Fires (68.0%), and Mobile Property/Vehicle Fires (14.4%).