Kissimmee: Fire Incidents, Florida (FL)
Where are fire incidents reported in Kissimmee, FL
Something went wrong! Please refresh the page.
| Fire incidents reported | |
|---|---|
| Sreet name | Count |
| IRLO BRONSON MEM HWY | 484 |
| VINE ST | 386 |
| JOHN YOUNG | 188 |
| 192 HWY | 160 |
| OSCEOLA | 140 |
| POINCIANA BLVD | 138 |
| BOGGY CREEK RD | 126 |
| PLEASANT HILL RD | 124 |
| 192 | 106 |
| INTERSTATE 4 | 104 |
| HOAGLAND BLVD | 102 |
| OLD LAKE WILSON RD | 82 |
| OSCEOLA PKY | 82 |
| MICHIGAN AVE | 80 |
| OAK ST | 80 |
| ORANGE BLOSSOM TRL | 80 |
| VINELAND RD | 80 |
| DORADO DR | 74 |
| MABBETTE ST | 70 |
| SIMPSON RD | 70 |
| W VINE ST | 60 |
| HAM BROWN RD | 56 |
| CENTRAL AVE | 54 |
| ORANGE BLOSSOM | 54 |
| PARKWAY BLVD | 52 |
| DYER BLVD | 48 |
| IRLO BRONSON HWY | 46 |
| OLD TAMPA HWY | 46 |
| DONEGAN AVE | 44 |
| FLORIDAS TURNPIKE | 44 |
| Other | 4,045 |
2004 - 2018 National Fire Incident Reporting System (NFIRS) incidents
- Incident types reported to NFIRS in Kissimmee, FL
- 60,41067.8%Rescue & EMS
- 7,7508.7%Good Intent Call
- 7,3058.2%Fire
- 5,6906.4%False Alarm
- 4,4415.0%Service Call
- 3,3653.8%Hazardous Condition
- Fire incident types reported to NFIRS in Kissimmee, FL
- 2,99841.0%Outside Fires
- 2,68136.7%Structure Fires
- 1,45119.9%Mobile Property/Vehicle Fires
- 1752.4%Other
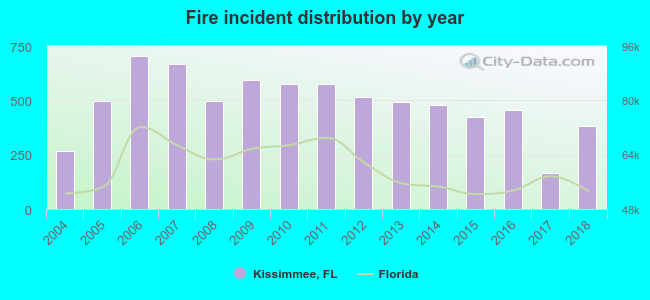 According to the data from the years 2004 - 2018 the average number of fires per year is 486. The highest number of reported fire incidents - 704 took place in 2006, and the least - 166 in 2017. The data has a growing trend.
The average number of yearly fire incidents per 10k residents in Kissimmee, FL compared to nearest cities:
(Note: Based on data for the last 3 years, including only cities with population 5,000 and above)
| Kissimmee: | 50.3 |
| Celebration: | 16.6 |
| Poinciana: | 23.2 |
| Belle Isle: | 4.6 |
| Orlando: | 67.7 |
| Haines City: | 85.2 |
| Ocoee: | 36.9 |
| Alafaya: | 0.2 |
| Winter Garden: | 38.1 |
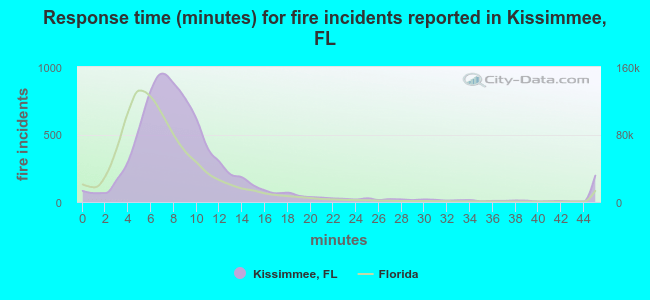 The median response time based on all reported fire incidents is 8 minutes. This is higher compared to the Florida median value.
The median response time in Kissimmee, FL compared to nearest cities:
(Note: Based on data for all years, including only cities with at least 500 fire incidents)
| Kissimmee: | 8 minutes |
| St. Cloud: | 6 minutes |
| Poinciana: | 10 minutes |
| Davenport: | 9 minutes |
| Orlando: | 7 minutes |
| Haines City: | 8 minutes |
| Ocoee: | 6 minutes |
| Winter Garden: | 6 minutes |
| Winter Park: | 6 minutes |
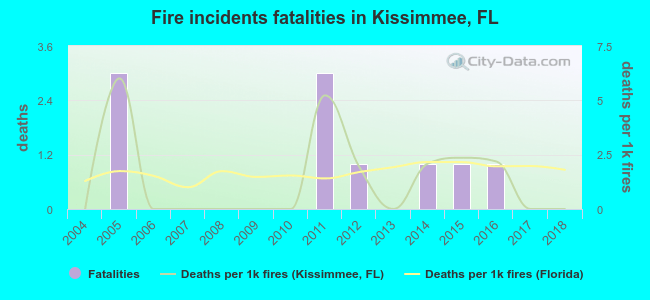 Based on the reports from the years 2004 - 2018 the average number of fire-related fatalities per year is 1. The highest number of deaths - 3 took place in 2005, and the lowest - 0 in 2004. The data has a constant trend.
The average number of deaths per 1,000 fires is 1. This indicator was the highest - 6 in 2005, and the lowest 0 in 2004. The trend for fatalities per 1,000 incidents is constant. Compared to the Florida value the number of fatalities per 1,000 fire incidents is lower.
Based on the reports from the years 2004 - 2018 the average number of fire-related fatalities per year is 1. The highest number of deaths - 3 took place in 2005, and the lowest - 0 in 2004. The data has a constant trend.
The average number of deaths per 1,000 fires is 1. This indicator was the highest - 6 in 2005, and the lowest 0 in 2004. The trend for fatalities per 1,000 incidents is constant. Compared to the Florida value the number of fatalities per 1,000 fire incidents is lower.Deaths per 1,000 incidents in Kissimmee, FL compared to nearest cities:
(Note: Based on data for all years, including only cities with at least 2,500 fire incidents)
| Kissimmee: | 1.4 |
| Orlando: | 1.3 |
| Apopka: | 2.5 |
| Winter Haven: | 2.4 |
| Clermont: | 1.8 |
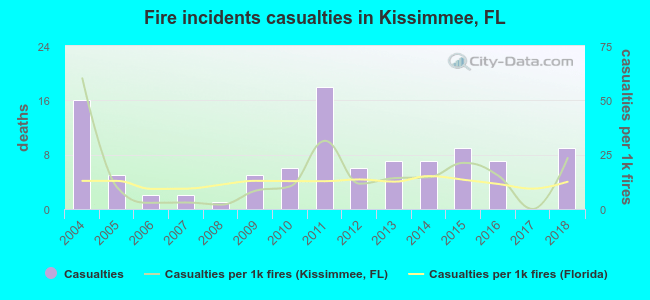 Based on the reports from the years 2004 - 2018 the average number of fire-related yearly casualties is 7. The highest number of reported injuries - 18 took place in 2011, and the lowest - 0 in 2017. The data has a declining trend.
The average number of injuries per 1,000 fires is 15. This indicator was the highest - 60 in 2004, and the lowest 0 in 2017. The trend for casualties per 1,000 incidents is declining. Compared to the Florida value the number of casualties per 1,000 fire incidents is similar.
Based on the reports from the years 2004 - 2018 the average number of fire-related yearly casualties is 7. The highest number of reported injuries - 18 took place in 2011, and the lowest - 0 in 2017. The data has a declining trend.
The average number of injuries per 1,000 fires is 15. This indicator was the highest - 60 in 2004, and the lowest 0 in 2017. The trend for casualties per 1,000 incidents is declining. Compared to the Florida value the number of casualties per 1,000 fire incidents is similar.Casualties per 1,000 incidents in Kissimmee, FL compared to nearest cities:
(Note: Based on data for all years, including only cities with at least 500 fire incidents)
| Kissimmee: | 13.7 |
| St. Cloud: | 15.0 |
| Poinciana: | 15.3 |
| Davenport: | 4.7 |
| Orlando: | 19.3 |
| Haines City: | 5.3 |
| Ocoee: | 2.6 |
| Winter Garden: | 9.0 |
| Winter Park: | 24.3 |
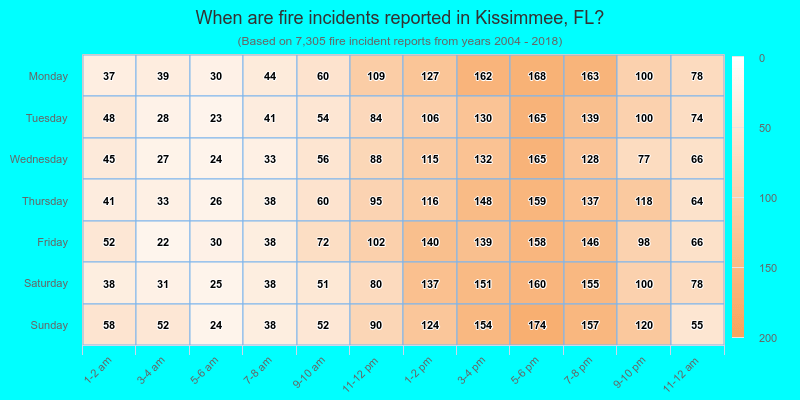
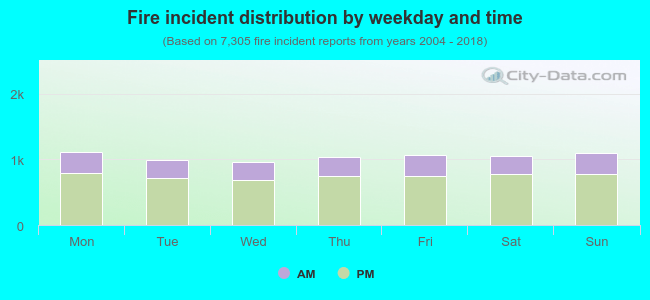 28.1% incidents where reported in the morning and 71.9% in the evening. The most fires (15.3%) took place on Monday, and the least (13.1%) on Wednesday.
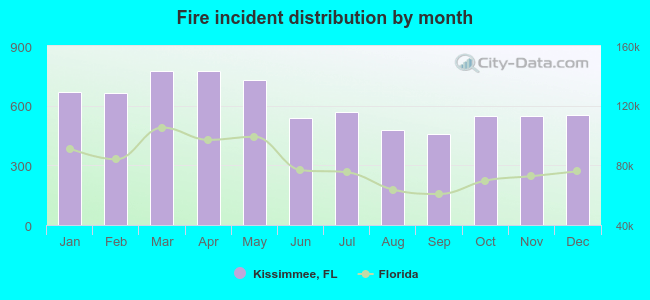 According to the 7,305 fire incident reports from years 2004 - 2018 most fires (10.6%) took place during April, and the least (6.3%) in September.
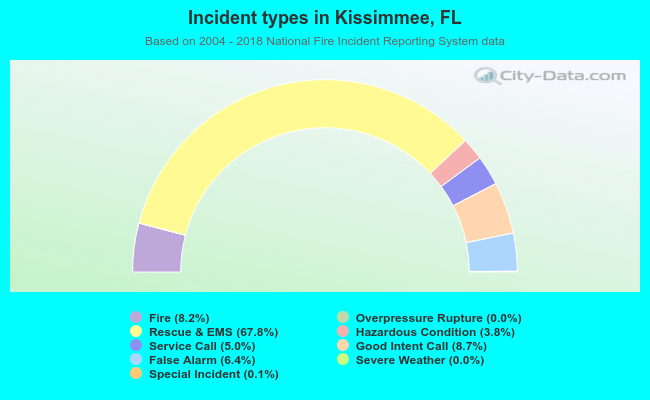 Out of all 89,085 cases reported during the years 2004 - 2018, the most belonged to the categories: Rescue & EMS (67.8%), Good Intent Call (8.7%), and Fire (8.2%).
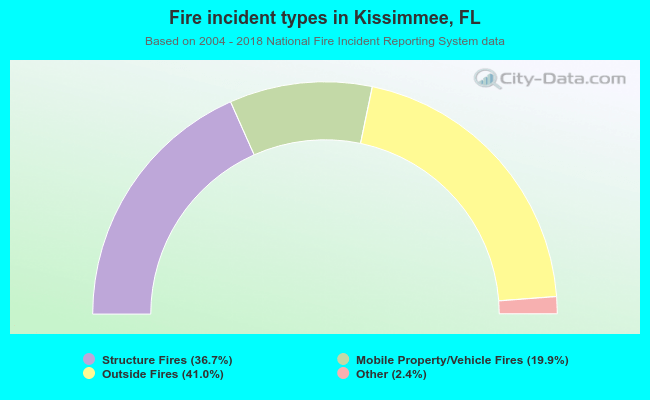 When looking into fire subcategories, the most reports belonged to: Outside Fires (41.0%), and Structure Fires (36.7%).