| Fire incidents reported |
|---|
| Sreet name | Count |
|---|
| MAIN ST | 16 | | PIERCE ST | 12 | | OKANOGAN ST | 8 | | SPOKANE ST | 8 | | CLERF RD | 6 | | LEWIS ST | 6 | | MILEPOST 116 FWY | 6 | | PATRICK AVE | 6 | | CLARK ST | 4 | | I-90 | 4 | | I-90 MP 115 WB | 4 | | I-90 MP 116 WB | 4 | | NO 81 RD | 4 | | RAILROAD AVE | 4 | | SR 821 HWY | 4 | | TONY CIR | 4 | | #81 ROAD RD | 2 | | 10 PIERCREST | 2 | | 109 N LEWIS | 2 | | 209 N CLARK ST | 2 | | 212 MAIN ST | 2 | | 2ND AVE | 2 | | 308 KING ST | 2 | | 308 KING STREET | 2 | | 500 N PIERCE ST | 2 |
| | | Fire incidents reported |
|---|
| Sreet name | Count |
|---|
| 701 NORTH SPOKANE ST | 2 | | 701 SPOKANE | 2 | | 901 SOUTH MAIN | 2 | | ALPINE DRIV | 2 | | BENTON ST | 2 | | BENTON ST | 2 | | CAMOZZY RD | 2 | | EB 115 | 2 | | HEMINGSTON RD | 2 | | I 90 EB HWY | 2 | | I-90 FWY | 2 | | I-90 MP 119 WB | 2 | | I-90 MP 122.5 WB | 2 | | I-90 MP 123 | 2 | | I-90 MP 124 EB | 2 | | I90 | 2 | | I90 EXIT 115 FWY | 2 | | INTERSTATE 90 FWY | 2 | | JENNIE CIR | 2 | | JENNY CIR | 2 | | JW TRAIL NEAR DEPOT | 2 | | KITTITAS HWY | 2 | | LEWIS & PATRICK | 2 | | LEWIS LANE & PATRICK AVE | 2 | | |
|
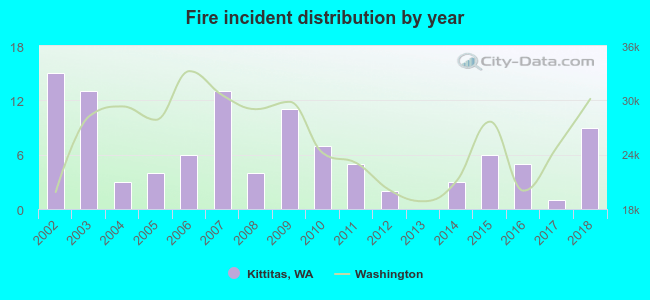 According to the data from the years 2002 - 2018 the average number of fires per year is 6. The highest number of reported fires - 15 took place in 2002, and the least - 0 in 2013. The data has a decreasing trend.
 29.9% incidents where reported in the morning and 70.1% in the evening. The most fires (18.7%) took place on Friday, and the least (9.3%) on Wednesday.
 According to the 107 reports from years 2002 - 2018 most fires (19.6%) took place during July, and the least (1.9%) in November.
 Out of all 522 cases reported during the years 2002 - 2018, the most belonged to the categories: Overpressure Rupture (62.3%), Fire (20.5%), and Rescue & EMS (4.6%).
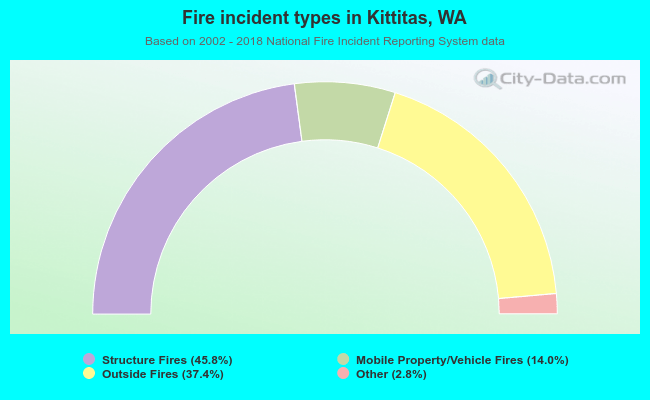 When looking into fire subcategories, the most incidents belonged to: Structure Fires (45.8%), and Outside Fires (37.4%).