| Fire incidents reported |
|---|
| Sreet name | Count |
|---|
| BOBBITT RD | 34 | | CHAVIS RD | 34 | | RALEIGH RD | 16 | | CHARLIE GRISSOM RD | 14 | | LYNNBANK RD | 12 | | EGYPT MOUNTAIN RD | 10 | | WALTER GRISSOM RD | 10 | | DICK SMITH RD | 8 | | FERN LN | 8 | | FRANK SNEED RD | 8 | | SIMS BRIDGE RD | 8 | | DIXIE DR | 6 | | JULIE MCKNIGHT RD | 6 | | KITTRELL COLLEGE RD | 6 | | ROCKY FORD RD | 6 | | US 1 HWY | 6 | | 3838 US 1 HWY S | 4 | | 389 WOODLIEF RD | 4 | | 986 N CHAVIS RD | 4 | | ALLENS WAY | 4 | | AYSCUE LN | 4 | | BRIGGS RD | 4 | | CANNADY MILL RD | 4 | | CHAVIS ROAD | 4 | | CHERRY LN | 4 |
| | | Fire incidents reported |
|---|
| Sreet name | Count |
|---|
| EGYPT MOUNTIAN ROAD | 4 | | KITTRELL COLLEGE RD | 4 | | KITTRELL RD | 4 | | LILLY LN | 4 | | N CHAVIS RD | 4 | | PEACEFUL LANE | 4 | | PLANTATION DR | 4 | | SMITH ST | 4 | | US 1 | 4 | | US 1 SOUTH | 4 | | US1 HWY | 4 | | 103 TABBS CREEK | 2 | | 104 VAN ZANDT LN | 2 | | 1040 DICK SMITH RD | 2 | | 1050 KITTRELL COLLEGE RD | 2 | | 1051 N CHAVIS | 2 | | 1051 N CHAVIS RD | 2 | | 1051 NORTH CHAVIS RD | 2 | | 106 KITTRELL VANCE AVE | 2 | | 1096 US1 BYPASS S | 2 | | 1112 N CHAVIS RD | 2 | | 115 MOSS STOCK FARM RD | 2 | | 117 ROCK BLUFF | 2 | | 1180 BOBBITT RD | 2 | | 1191 BOBBITT RD | 2 |
|
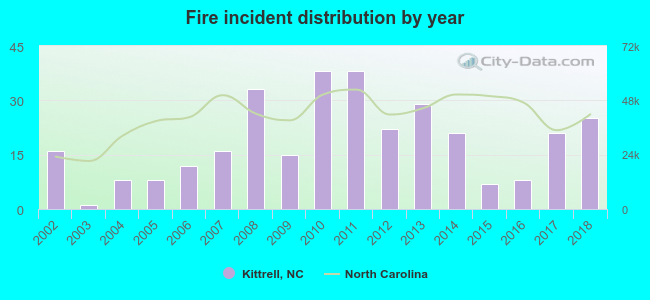 According to the data from the years 2002 - 2018 the average number of fire incidents per year is 19. The highest number of fires - 38 took place in 2010, and the least - 1 in 2003. The data has a rising trend.
 32.4% incidents where reported in the morning and 67.6% in the evening. The most fires (19.5%) took place on Friday, and the least (10.1%) on Wednesday.
 According to the 318 fire incidents from years 2002 - 2018 most fires (15.1%) took place during February, and the least (2.5%) in September.
 Out of all 915 cases reported during the years 2002 - 2018, the most belonged to the categories: Rescue & EMS (44.6%), Fire (34.8%), and Good Intent Call (10.3%).
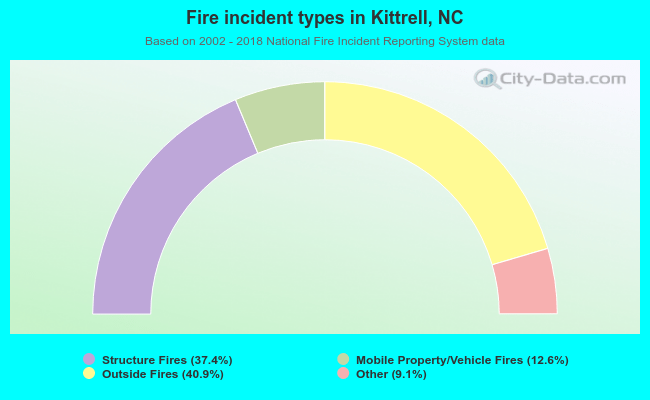 When looking into fire subcategories, the most incidents belonged to: Outside Fires (40.9%), and Structure Fires (37.4%).