Knightstown: Fire Incidents, Indiana (IN)
Where are fire incidents reported in Knightstown, IN
Something went wrong! Please refresh the page.
|
| |||||||||||||||||||||||||||||||||||||||||||||||||||||||||||||||||||||||||||||||||||||||||||||||||||||||||||||
2002 - 2018 National Fire Incident Reporting System (NFIRS) incidents
- Incident types reported to NFIRS in Knightstown, IN
- 70140.8%Rescue & EMS
- 39723.1%Fire
- 21612.6%Hazardous Condition
- 18510.8%Good Intent Call
- 1679.7%Service Call
- 502.9%False Alarm
- 30.2%Special Incident
- Fire incident types reported to NFIRS in Knightstown, IN
- 16942.6%Outside Fires
- 13133.0%Structure Fires
- 8020.2%Mobile Property/Vehicle Fires
- 174.3%Other
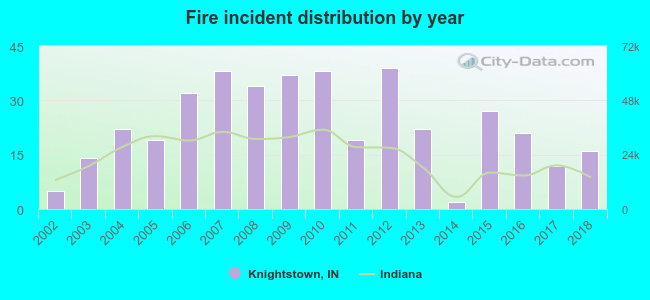 Based on the data from the years 2002 - 2018 the average number of fire incidents per year is 23. The highest number of reported fires - 39 took place in 2012, and the least - 2 in 2014. The data has a growing trend.
 24.2% incidents where reported in the morning and 75.8% in the evening. The most fires (17.6%) took place on Sunday, and the least (10.8%) on Tuesday.
 Based on the 397 fire incidents from years 2002 - 2018 most fires (11.3%) took place during March, and the least (4.8%) in December.
 Out of all 1,719 cases reported during the years 2002 - 2018, the most belonged to the categories: Overpressure Rupture (40.8%), Fire (23.1%), and Rescue & EMS (12.6%).
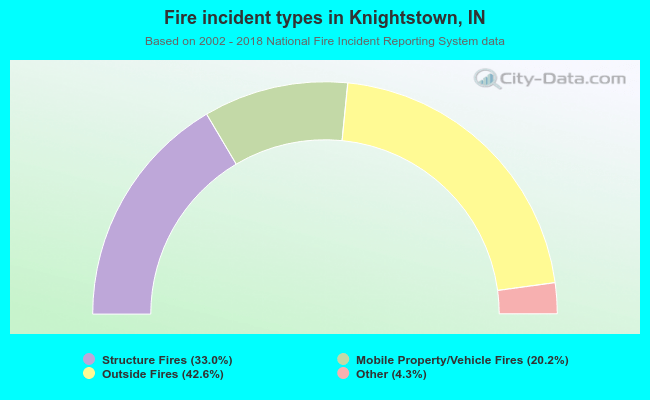 When looking into fire subcategories, the most reports belonged to: Outside Fires (42.6%), and Structure Fires (33.0%).