| Fire incidents reported |
|---|
| Sreet name | Count |
|---|
| STATE ROUTE 819 | 16 | | I24 WESTBOUND | 14 | | STATE ROUTE 810 | 12 | | STATE ROUTE 810 NORTH | 10 | | CHESTNUT OAK ROAD | 8 | | LAKE BARKLEY DR | 8 | | US HWY 62 WEST | 8 | | BAR-X LN | 6 | | BEECH ST | 6 | | I24 EASTBOUND | 6 | | LAKESHORE DR | 6 | | POPLAR CREEK RD | 6 | | RICE ROAD | 6 | | STATE ROUTE 295 | 6 | | STATE ROUTE 93 NORTH | 6 | | BEECH STREET | 4 | | CHESTNUT OAK RD | 4 | | COBBLESTONE | 4 | | DAYS INN DRIVE | 4 | | GEORGE THOMAS RD | 4 | | GUM STREET | 4 | | HWY 295 NORTH | 4 | | I-24 | 4 | | MARTINS CHAPEL ROAD | 4 | | MCKINNEY RD | 4 |
| | | Fire incidents reported |
|---|
| Sreet name | Count |
|---|
| MCKINNEY ROAD | 4 | | NEW CIRCLE DR | 4 | | NEW CIRCLE DRIVE | 4 | | POPLAR CREEK ROAD | 4 | | ROCK BOWL SPRINGS | 4 | | RUSTY RIDGE RD | 4 | | ST RT 93 NORTH | 4 | | STATE ROUTE 1271 | 4 | | STATE ROUTE 810 SOUTH | 4 | | SUWANEE HILL | 4 | | TIMBER LN | 4 | | WOODALL ROAD | 4 | | 1253 LAKE BARKLEY DR | 2 | | 1253 LAKE BARKLEY DRIVE | 2 | | 2000 BLOCK ST RT 819 | 2 | | 300 BEECH ST | 2 | | 35 MM EB I69I24 | 2 | | 5TH STREET | 2 | | 810 SOUTH CHESTNUT OAK RD | 2 | | 93 NORTH CUMBERLAND RIVER | 2 | | 93 NORTH POPLAR CREEK RD | 2 | | BARKLEY DAM | 2 | | BEECH STREET & HWY 295 | 2 | | BILL THOMPSON ROAD RD | 2 | | |
|
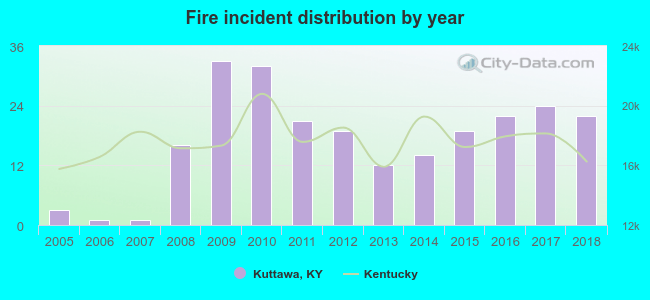 According to the data from the years 2005 - 2018 the average number of fires per year is 17. The highest number of fire incidents - 33 took place in 2009, and the least - 1 in 2006. The data has a rising trend.
 According to the reports from the years 2005 - 2018 the average number of fire-related casualties per year is 0. The highest number of reported casualties - 2 took place in 2011, and the lowest - 0 in 2005. The data has a constant trend.
 31.4% incidents where reported in the morning and 68.6% in the evening. The most fires (20.5%) took place on Saturday, and the least (9.2%) on Tuesday.
 According to the 239 fires from years 2005 - 2018 most fires (10.5%) took place during July, and the least (5.4%) in October.
 Out of all 535 cases reported during the years 2005 - 2018, the most belonged to the categories: Fire (44.7%), Rescue & EMS (18.5%), and Hazardous Condition (12.1%).
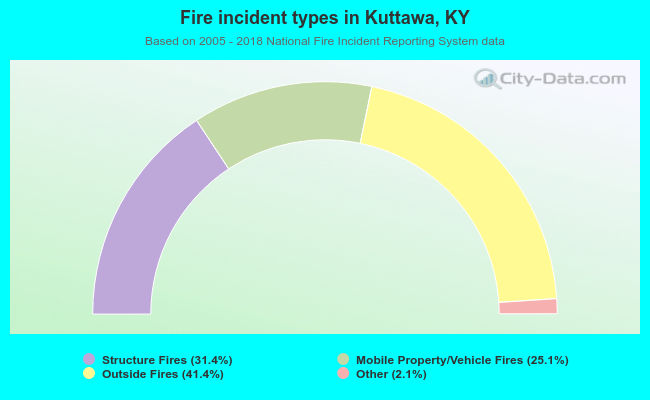 When looking into fire subcategories, the most reports belonged to: Outside Fires (41.4%), and Structure Fires (31.4%).