La Conner: Fire Incidents, Washington (WA)
Where are fire incidents reported in La Conner, WA
Something went wrong! Please refresh the page.
|
| |||||||||||||||||||||||||||||||||||||||||||||||||||||||||||||||||||||||||||||||||||||||||||||||||||||||||||||
2008 - 2018 National Fire Incident Reporting System (NFIRS) incidents
- Incident types reported to NFIRS in La Conner, WA
- 3,16975.0%Rescue & EMS
- 3929.3%Fire
- 3408.0%Hazardous Condition
- 801.9%False Alarm
- 781.8%Special Incident
- 751.8%Severe Weather
- 521.2%Good Intent Call
- 360.9%Service Call
- 50.1%Overpressure Rupture
- Fire incident types reported to NFIRS in La Conner, WA
- 21354.3%Outside Fires
- 13534.4%Structure Fires
- 4010.2%Mobile Property/Vehicle Fires
- 41.0%Other
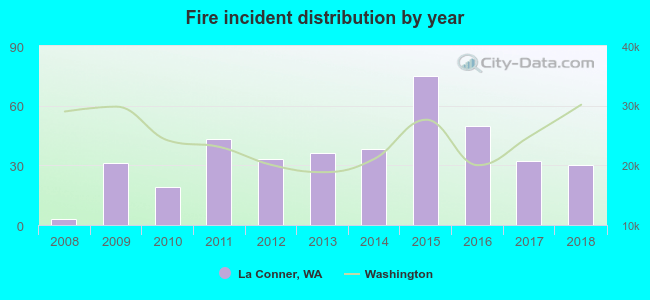 According to the data from the years 2008 - 2018 the average number of fires per year is 35. The highest number of reported fires - 75 took place in 2015, and the least - 3 in 2008. The data has an increasing trend.
 33.4% incidents where reported in the morning and 66.6% in the evening. The most fires (19.4%) took place on Saturday, and the least (11.5%) on Thursday.
 According to the 392 reports from years 2008 - 2018 most fires (34.4%) took place during July, and the least (3.6%) in April.
 Out of all 4,227 cases reported during the years 2008 - 2018, the most belonged to the categories: Rescue & EMS (75.0%), Fire (9.3%), and Hazardous Condition (8.0%).
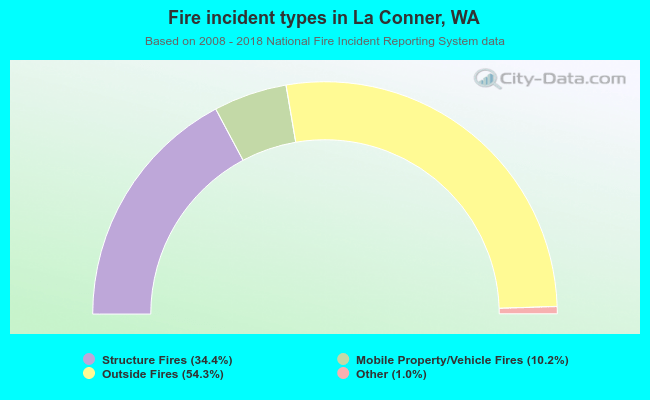 When looking into fire subcategories, the most incidents belonged to: Outside Fires (54.3%), and Structure Fires (34.4%).