| Fire incidents reported |
|---|
| Sreet name | Count |
|---|
| 1 ORGANIC WAY | 6 | | DUTCH HOLLOW RD RD | 6 | | E13596 HWY 82 | 6 | | S2014 SAND HILL RD | 6 | | COUNTY ROAD A | 4 | | CTY RD D | 4 | | E10615 STH 82 | 4 | | E12953 DUTCH HOLLOW RD | 4 | | E13758 STH 82 | 4 | | E14218 W NEWBURN AVE | 4 | | E14599 MORNING STAR RD | 4 | | HWY 82 EAST | 4 | | MORNING STAR RD | 4 | | SAND HILL RD | 4 | | STATE HWY 82 | 2 | | 10080 LIEURANCE RD | 2 | | 103 N SILVER ST | 2 | | 110 S MAPLE STREET | 2 | | 111 W MAIN ST | 2 | | 111 W. MAIN ST | 2 | | 12371 DUTCH HOLLOW ROAD | 2 | | 17051 13TH AVE | 2 | | 17051 13 RD | 2 | | 202 SNOW ST | 2 | | 209 N. STATE STREET | 2 |
| | | Fire incidents reported |
|---|
| Sreet name | Count |
|---|
| 210 E MAIN ST | 2 | | 213 W. S. PEARL STREET | 2 | | 217 W MAIN ST | 2 | | 217 W MAIN STREET | 2 | | 219 W S PEARL ST | 2 | | 24 VALLEY ROAD | 2 | | 245 S. STATE STREET | 2 | | 303 N STATE STREET | 2 | | 312 E. MAIN STREET | 2 | | 3955 CTY RD. A | 2 | | 419 W SNOW ST | 2 | | 54651 N. ELK RUN ROAD | 2 | | 581 MAIN STREET | 2 | | 628 N MAPLE ST | 2 | | ALLEN ROAD RD | 2 | | AUMOCK ROAD | 2 | | BICKLE RD | 2 | | BRUSH HOLLOW ROAD | 2 | | CHERRY VALLEY RD | 2 | | COUNTY HWY D INTERSECT A DRS | 2 | | COUNTY RD D | 2 | | CTH D | 2 | | CTY HWY A | 2 | | CTY RD A | 2 | | |
|
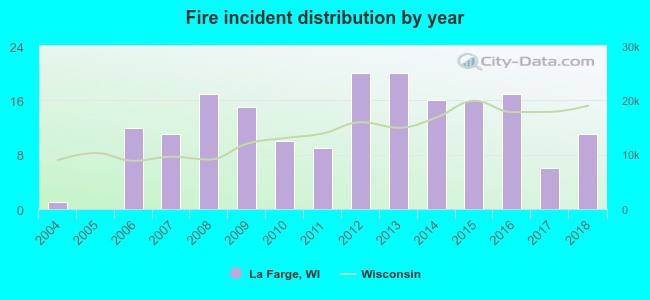 Based on the data from the years 2004 - 2018 the average number of fire incidents per year is 12. The highest number of fires - 20 took place in 2012, and the least - 0 in 2005. The data has an increasing trend.
 28.2% incidents where reported in the morning and 71.8% in the evening. The most fires (19.3%) took place on Sunday, and the least (9.4%) on Friday.
 Based on the 181 incident reports from years 2004 - 2018 most fires (23.8%) took place during April, and the least (3.3%) in December.
 Out of all 323 cases reported during the years 2004 - 2018, the most belonged to the categories: Fire (56.0%), Overpressure Rupture (12.7%), and Rescue & EMS (12.4%).
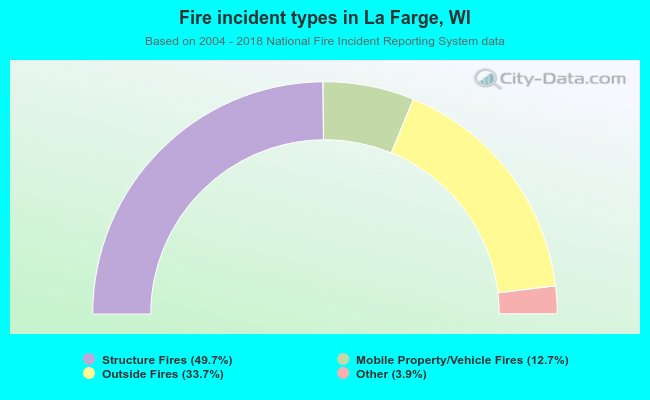 When looking into fire subcategories, the most reports belonged to: Structure Fires (49.7%), and Outside Fires (33.7%).