| Fire incidents reported |
|---|
| Sreet name | Count |
|---|
| HIGH ST | 28 | | OSBUN RD | 16 | | WINNEMAC PIKE | 16 | | FRONT ST | 8 | | SCHOOL ST | 8 | | STATE ROUTE 37 HWY | 8 | | DRY LANE RD | 6 | | MARKET ST | 6 | | ST RT 37 | 6 | | BIG ISLAND- DECLIFF RD | 4 | | DECLIFF RD | 4 | | GROUND HOG PIKE | 4 | | LA RUE DECLIFF RD | 4 | | LARUE DECLIFF RD | 4 | | LARUE-DECLIFF RD | 4 | | LARUE-GREEN CAMP RD | 4 | | MARIONAGOSTA RD | 4 | | MARSH ST | 4 | | MCCORMICK ST | 4 | | SECTION ST | 4 | | ST RT 309 | 4 | | STATE ROUTE 95 HWY | 4 | | WILDCAT PIKE | 4 | | WINDFALL RD | 4 | | 12181 CLARK RD | 2 |
| | | Fire incidents reported |
|---|
| Sreet name | Count |
|---|
| 17 SOUTH HIGH | 2 | | 17538 TWP RD 247 | 2 | | 212 N FRONT ST | 2 | | 23697 TWP RD 230 | 2 | | 23821 COUNTY ROAD 202 | 2 | | 2537 ROBISON RD | 2 | | AGOSTA LARUE | 2 | | AGOSTA NORTHERN RD | 2 | | ALLEN | 2 | | BOUNDRY | 2 | | CHATAQUE ST | 2 | | CHESTNUT ST | 2 | | CLARK RD | 2 | | CO RD 144 | 2 | | CO RD 245 RD | 2 | | CONLEY THOMPSON RD | 2 | | DECLIFF RD N | 2 | | DECLIFF RD. | 2 | | E. UNION ST. | 2 | | EAST VINE | 2 | | ESSEX | 2 | | ESSEX RD | 2 | | FISHDAUM RD | 2 | | FULTON CREEK RD | 2 | | |
|
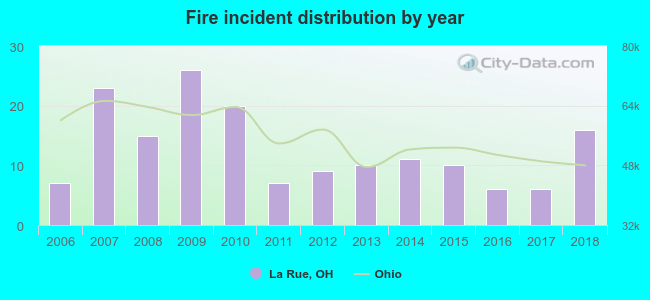 According to the data from the years 2006 - 2018 the average number of fire incidents per year is 13. The highest number of reported fires - 26 took place in 2009, and the least - 6 in 2016. The data has an increasing trend.
 31.9% incidents where reported in the morning and 68.1% in the evening. The most fires (18.1%) took place on Monday, and the least (9.0%) on Tuesday.
 Based on the 166 incident reports from years 2006 - 2018 most fires (13.9%) took place during July, and the least (4.2%) in February.
 Out of all 510 cases reported during the years 2006 - 2018, the most belonged to the categories: Overpressure Rupture (47.3%), Fire (32.5%), and Hazardous Condition (9.0%).
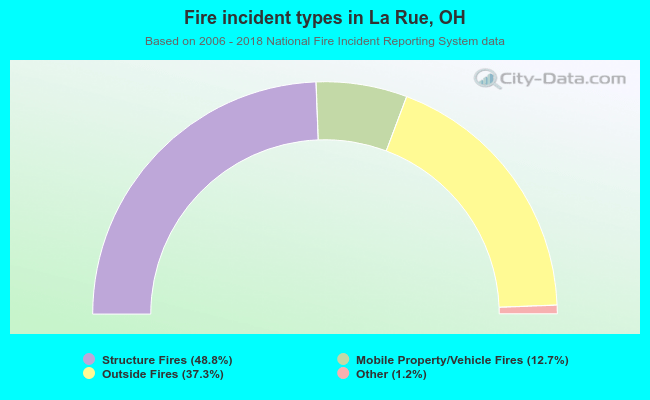 When looking into fire subcategories, the most incidents belonged to: Structure Fires (48.8%), and Outside Fires (37.3%).