| Fire incidents reported |
|---|
| Sreet name | Count |
|---|
| CR 319 | 8 | | FM 775 | 8 | | 109 LEGACY VIEW | 6 | | 87 @ CENTRAL TEXAS CATTLE | 6 | | CR 307 | 6 | | CR 317 | 6 | | FM 1346 | 6 | | ZUEHL CROSSING | 6 | | 100 MARX LANE | 4 | | 122 POST OAK | 4 | | 13005 FM 539 | 4 | | 13066 FM 539 | 4 | | 14500 FM 1346 | 4 | | 18800 FM 539 | 4 | | 208 HICKORY RUN | 4 | | 2322 COUNTY ROAD 321 | 4 | | 272 CR 342 | 4 | | 305 FM 775 | 4 | | 337 CR 342 | 4 | | 3449 FM 775 | 4 | | 347 ROSE MEADOW | 4 | | 610 CR 342 | 4 | | 80 POST OAK ROAD | 4 | | CR 341 AND CR 342 | 4 | | CR 342 AND CR 341 | 4 |
| | | Fire incidents reported |
|---|
| Sreet name | Count |
|---|
| CR 356 & US HWY. 87 | 4 | | ENCHANTED OAK | 4 | | ENCHANTED OAKS DR | 4 | | FM 539 | 4 | | HICKORY GROVE | 4 | | HIGHWAY 87 | 4 | | HWY 87 | 4 | | LEGACY RUN DR | 4 | | US HWY 87 HWY | 4 | | US HWY 87 W | 4 | | WILSON COUNTY | 4 | | 000 | 2 | | 100 BLK BLACK JACK | 2 | | 100 BOECK ST | 2 | | 10043 HWY 87 W | 2 | | 10133 US HWY 87 W | 2 | | 103 POST OAK ROAD | 2 | | 106 ROSE WOOD DR | 2 | | 110 OAK LEAF | 2 | | 111 SENIC HILLS DR | 2 | | 11161 FM 775 | 2 | | 11239 HWY 87 W | 2 | | 115 OAK CREEK DRIVE | 2 | | 115 OAK VIEW DRIVE | 2 | | |
|
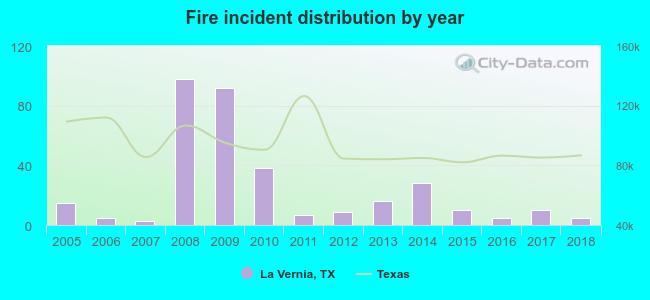 According to the data from the years 2005 - 2018 the average number of fires per year is 24. The highest number of reported fire incidents - 98 took place in 2008, and the least - 3 in 2007. The data has a dropping trend.
 26.4% incidents where reported in the morning and 73.6% in the evening. The most fires (18.2%) took place on Tuesday, and the least (11.7%) on Friday.
 Based on the 341 reports from years 2005 - 2018 most fires (17.9%) took place during January, and the least (3.5%) in November.
 Out of all 486 cases reported during the years 2005 - 2018, the most belonged to the categories: Fire (70.2%), Rescue & EMS (10.5%), and Service Call (8.0%).
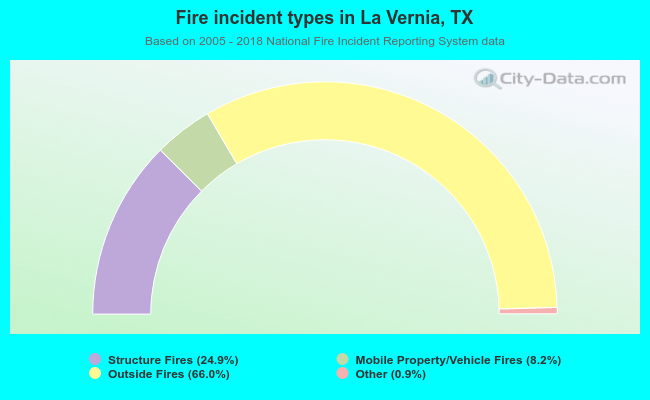 When looking into fire subcategories, the most reports belonged to: Outside Fires (66.0%), and Structure Fires (24.9%).