La Villa: Fire Incidents, Texas (TX)
Where are fire incidents reported in La Villa, TX
Something went wrong! Please refresh the page.
|
| |||||||||||||||||||||||||||||||||||||||||||||||||||||||||||||||||||||||||||||||||||||||||||||||||||||||||||||
| Other | 80 | |||||||||||||||||||||||||||||||||||||||||||||||||||||||||||||||||||||||||||||||||||||||||||||||||||||||||||||
2003 - 2016 National Fire Incident Reporting System (NFIRS) incidents
- Incident types reported to NFIRS in La Villa, TX
- 38675.2%Fire
- 9718.9%Hazardous Condition
- 101.9%Rescue & EMS
- 91.8%Service Call
- 81.6%Good Intent Call
- 30.6%False Alarm
- Fire incident types reported to NFIRS in La Villa, TX
- 30779.5%Outside Fires
- 4712.2%Structure Fires
- 297.5%Mobile Property/Vehicle Fires
- 30.8%Other
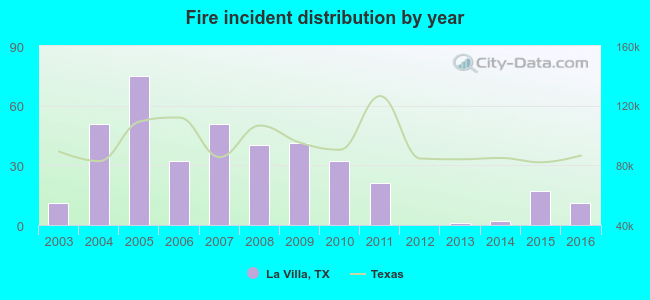 According to the data from the years 2003 - 2016 the average number of fires per year is 28. The highest number of reported fire incidents - 75 took place in 2005, and the least - 0 in 2012. The data has a constant trend.
 26.2% incidents where reported in the morning and 73.8% in the evening. The most fires (17.4%) took place on Monday, and the least (9.3%) on Thursday.
 According to the 386 fire incident reports from years 2003 - 2016 most fires (19.4%) took place during January, and the least (2.1%) in September.
 Out of all 513 cases reported during the years 2003 - 2016, the most belonged to the categories: Fire (75.2%), Rescue & EMS (18.9%), and Overpressure Rupture (1.9%).
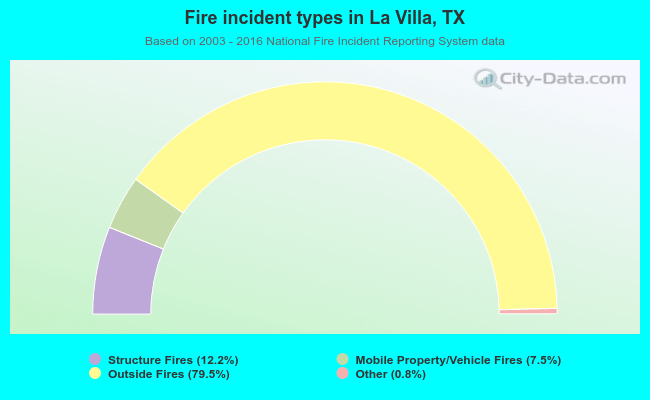 When looking into fire subcategories, the most reports belonged to: Outside Fires (79.5%), and Structure Fires (12.2%).