Labadieville: Fire Incidents, Louisiana (LA)
Where are fire incidents reported in Labadieville, LA
Something went wrong! Please refresh the page.
|
| |||||||||||||||||||||||||||||||||||||||||||||||||||||||||||||||||||||||||||||||||||||||||||||||||||||||||||||
2002 - 2018 National Fire Incident Reporting System (NFIRS) incidents
- Incident types reported to NFIRS in Labadieville, LA
- 22754.0%Rescue & EMS
- 13331.7%Fire
- 4210.0%Hazardous Condition
- 81.9%Service Call
- 71.7%False Alarm
- 20.5%Good Intent Call
- 10.2%Overpressure Rupture
- Fire incident types reported to NFIRS in Labadieville, LA
- 5541.4%Structure Fires
- 5440.6%Outside Fires
- 2216.5%Mobile Property/Vehicle Fires
- 21.5%Other
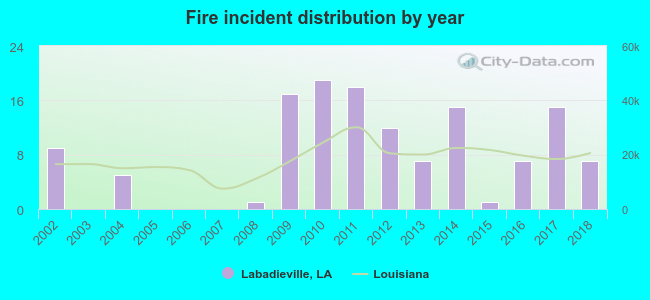 According to the data from the years 2002 - 2018 the average number of fire incidents per year is 8. The highest number of reported fires - 19 took place in 2010, and the least - 0 in 2003. The data has a dropping trend.
 33.8% incidents where reported in the morning and 66.2% in the evening. The most fires (19.5%) took place on Tuesday, and the least (7.5%) on Monday.
 According to the 133 reports from years 2002 - 2018 most fires (12.8%) took place during March, and the least (3.0%) in September.
 Out of all 420 cases reported during the years 2002 - 2018, the most belonged to the categories: Rescue & EMS (54.0%), Fire (31.7%), and Hazardous Condition (10.0%).
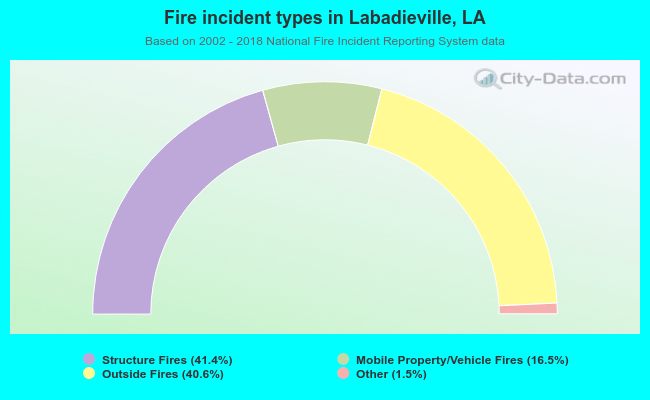 When looking into fire subcategories, the most incidents belonged to: Structure Fires (41.4%), and Outside Fires (40.6%).