| Fire incidents reported |
|---|
| Sreet name | Count |
|---|
| HWY 27 | 8 | | LINDOO AVE | 8 | | HWY 27 NORTH | 6 | | HWY 8 | 6 | | WORDEN AVE | 6 | | 1700 EDGEWOOD AVE | 4 | | 822 LAKE AVE E | 4 | | BELL SCHOOL RD | 4 | | CTY P HANSEN RD | 4 | | CTY RD G | 4 | | HWY 27 SOUTH | 4 | | N3172 AMBROSE RD | 4 | | RIVER AVE | 4 | | ROCKY RIDGE RD | 4 | | W 7032 OLD 14 RD | 4 | | W7327 OLD AIRPORT RD | 4 | | 1005 BRUNO AVE | 2 | | 101 W 9TH ST S | 2 | | 105 MINER AV | 2 | | 10TH ST NORTH | 2 | | 111 W WORDEN AVE | 2 | | 112 W LAKE AVE | 2 | | 1120 ADAMS AVE | 2 | | 117 MINER AVE W | 2 | | 129 WORDER AVE E | 2 |
| | | Fire incidents reported |
|---|
| Sreet name | Count |
|---|
| 200 LINDOO AVE E | 2 | | 202 E COLLEGE AVE | 2 | | 205 W NORTH AVE | 2 | | 209 E 3RD ST | 2 | | 211 W SABIN AVE | 2 | | 215 E WORDEN AVE | 2 | | 217 W 3RD ST N | 2 | | 218 E WORDEN AVE | 2 | | 300 W LAKE AVE | 2 | | 303 E 8TH ST S | 2 | | 303 W PETERSON AVE | 2 | | 305 PEDERSON AVE | 2 | | 311 W WORDEN AVE | 2 | | 312 E 12TH ST | 2 | | 316 W FRITZ AVE | 2 | | 3RD ST | 2 | | 404 E 8TH STREET S | 2 | | 406 E 2ND SOUTH | 2 | | 409 E 6TH ST N | 2 | | 411 EAST 3RD ST. S. | 2 | | 411 ROESLER AVE | 2 | | 501 SUMMIT | 2 | | 51 3 W11TH ST N | 2 | | 510 W FRITZ AVE | 2 | | 515 COLLEGE AVE | 2 |
|
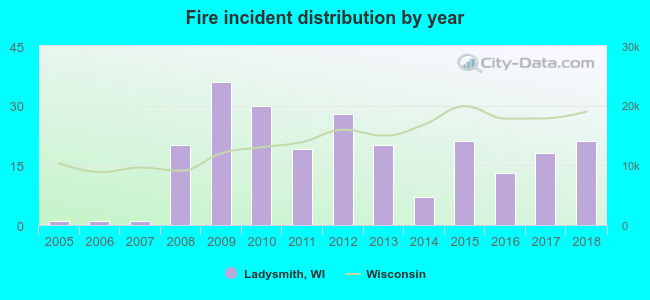 Based on the data from the years 2005 - 2018 the average number of fire incidents per year is 17. The highest number of fires - 36 took place in 2009, and the least - 1 in 2005. The data has an increasing trend.
 40.3% incidents where reported in the morning and 59.7% in the evening. The most fires (18.2%) took place on Monday, and the least (11.0%) on Thursday.
 Based on the 236 incident reports from years 2005 - 2018 most fires (17.4%) took place during April, and the least (5.1%) in October.
 Out of all 863 cases reported during the years 2005 - 2018, the most belonged to the categories: Rescue & EMS (34.0%), Fire (27.3%), and Hazardous Condition (23.1%).
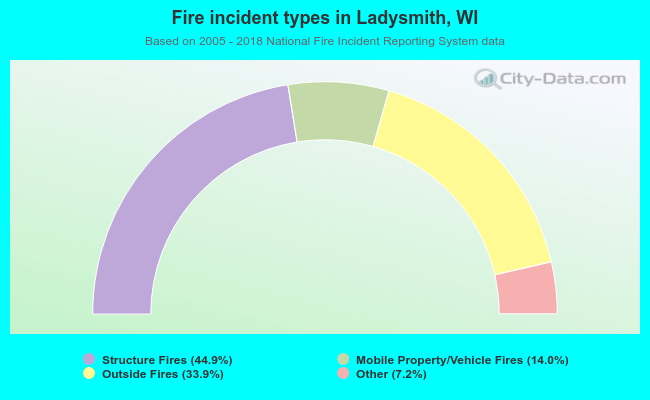 When looking into fire subcategories, the most reports belonged to: Structure Fires (44.9%), and Outside Fires (33.9%).